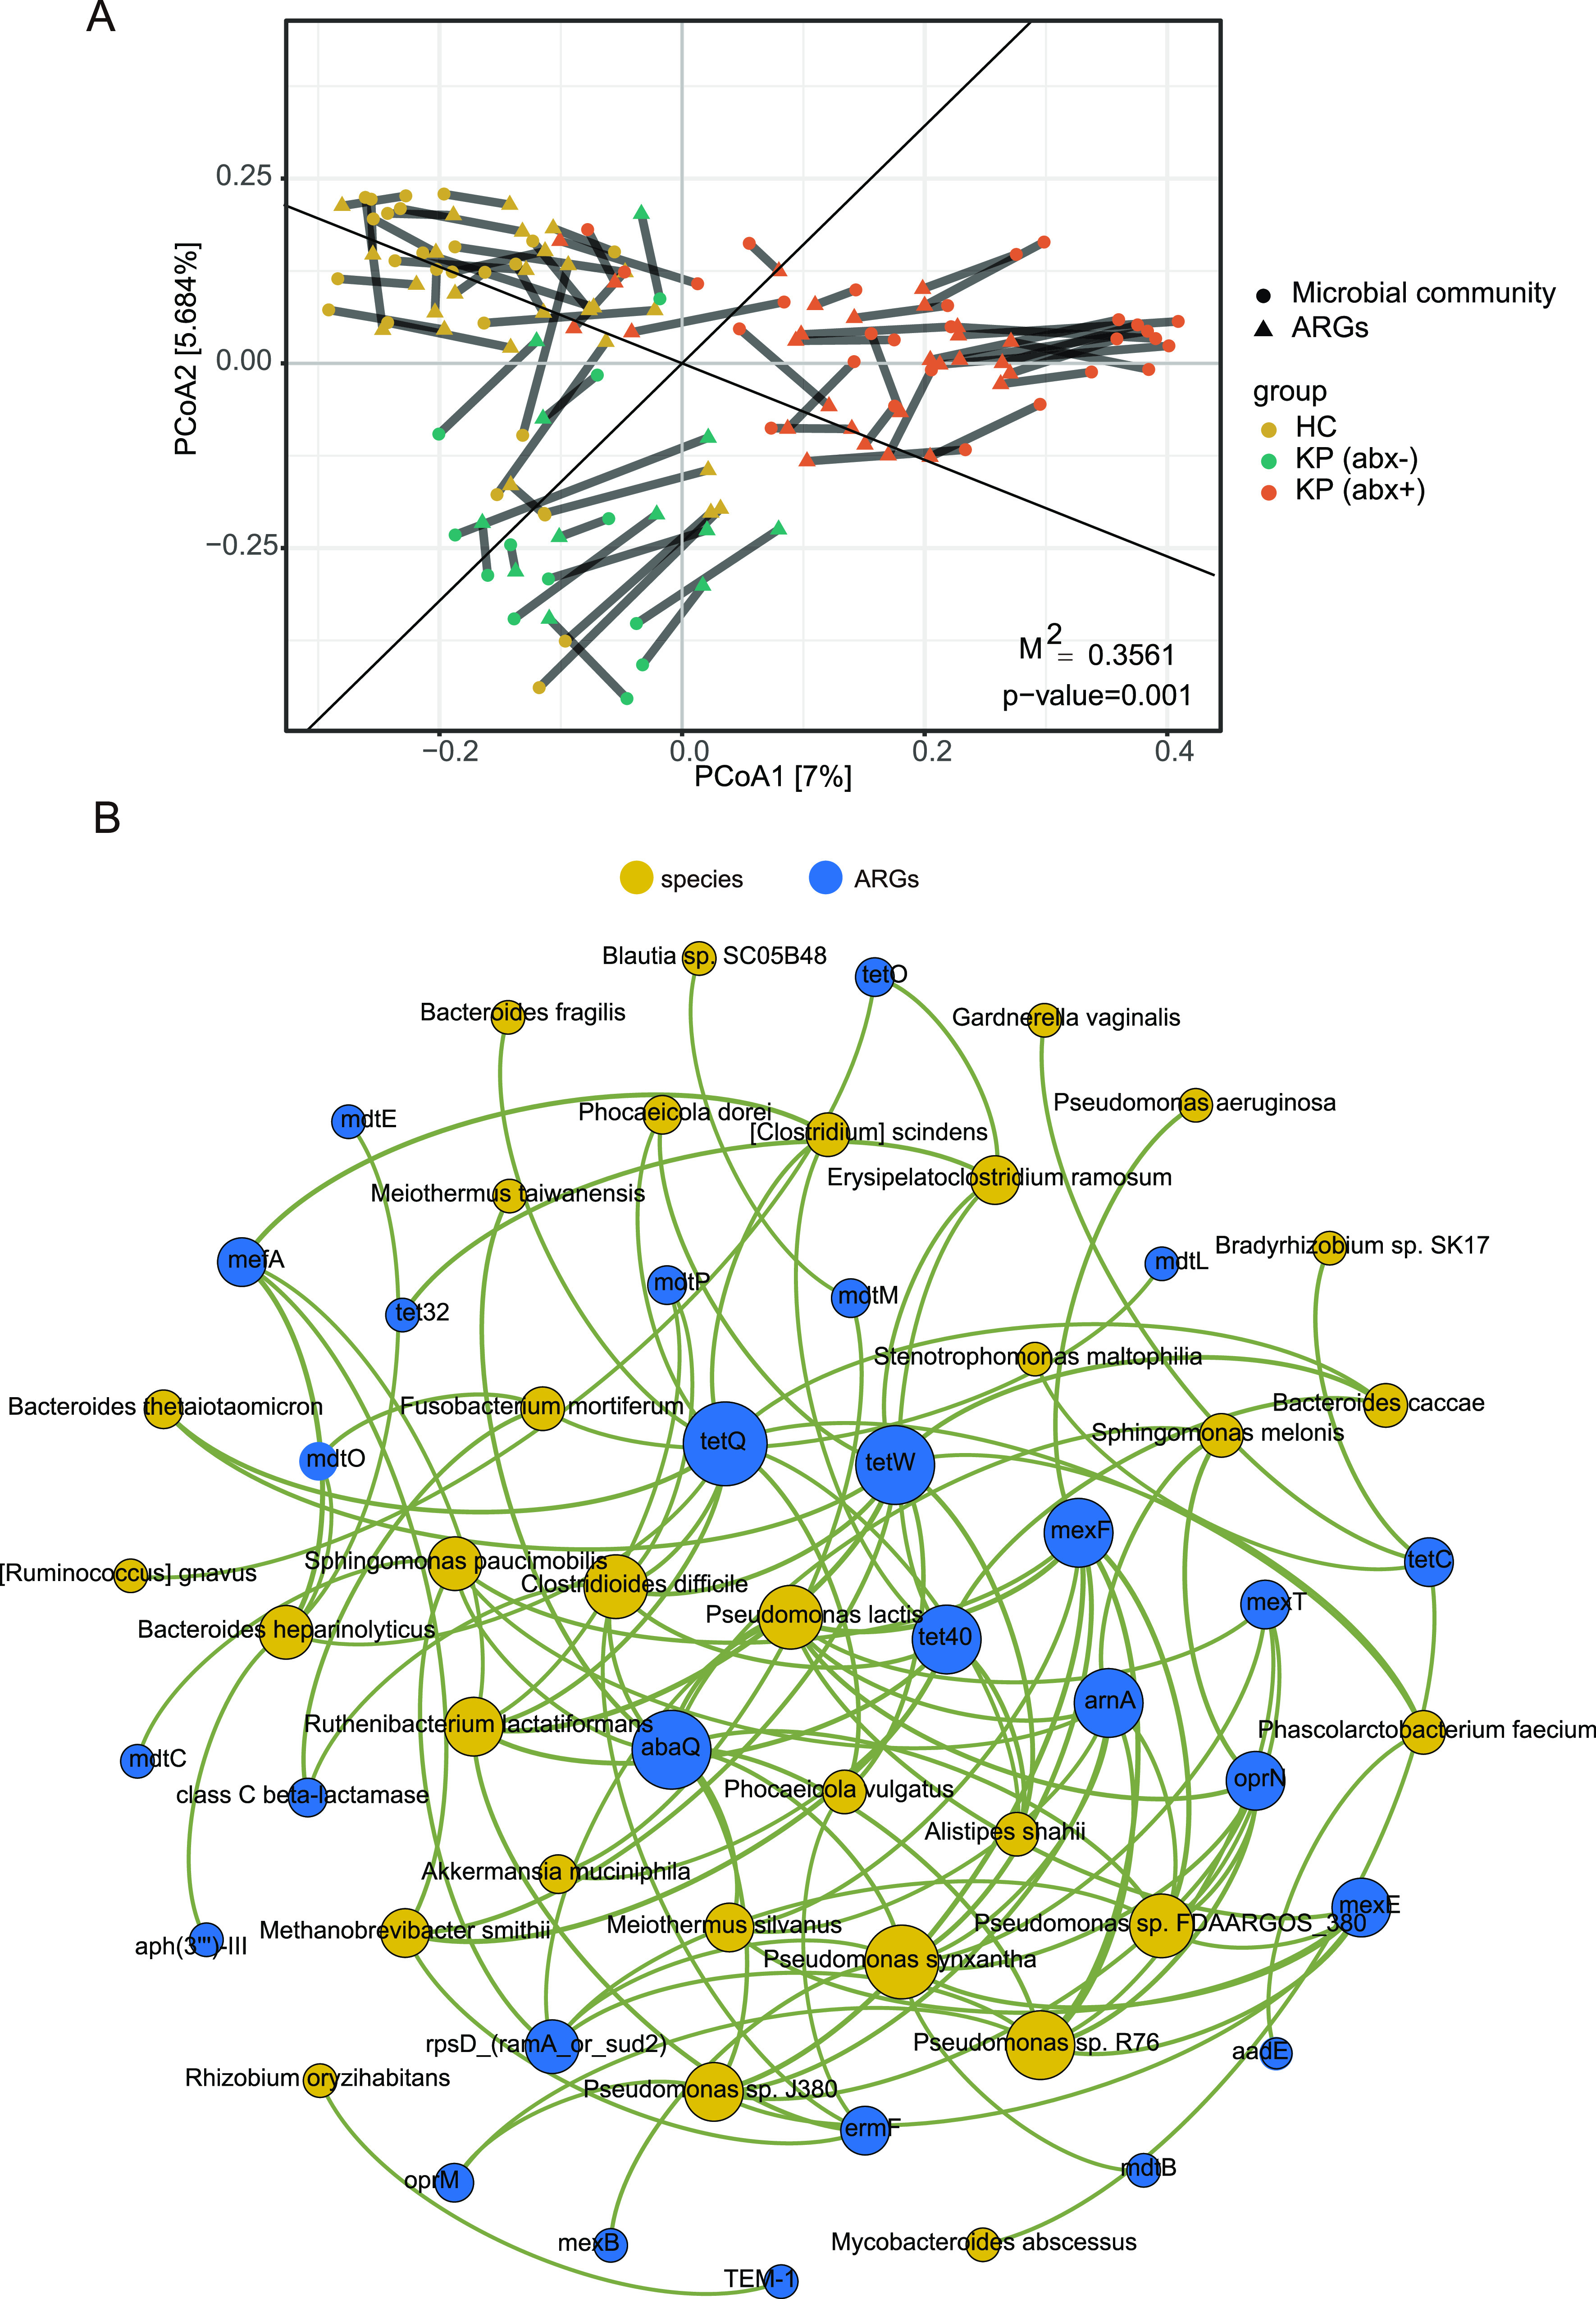
FIG 3.

(A) Procrustes analysis of the correlations between antibiotic resistome and microbiota structures based on a Bray-Curtis dissimilarity matrix. (B) Network analysis showing the cooccurrence pattern between ARG subtypes and microbial taxa based on Spearman’s correlation analysis. A connection represents a strong and significant correlation (FDR adjusted, P < 0.01, Spearman’s r > 0.6). The size of each node is proportional to the number of connections. The species nodes are colored yellow, and the ARG nodes are colored blue.
