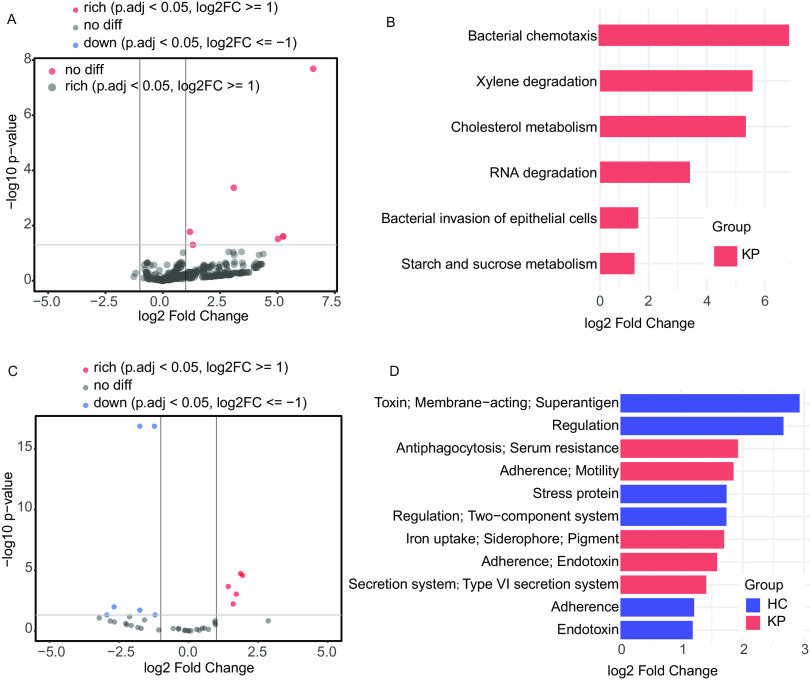
FIG 4.
(A and B) Volcano plot (A) and corresponding bar plot (B) of KEGG pathway function differential analysis comparing samples from HCs (n = 26) versus KPs (n = 40). (C and D) Volcano plot (C) and corresponding bar plot (D) of predicted virulence function differential analysis comparing samples from HCs (n = 26) versus KPs (n = 40). KEGG pathway functions and predicted virulence functions with log2 fold changes of >1 and adjusted P values of <0.05 were considered significant (solid gray lines). The statistical test was the Wald test in DeSeq2. The red color indicates an increase in the KP group versus the HC group. The blue-purple color indicates a decrease in the KP group versus the HC group. LDA, linear discriminant analysis.

