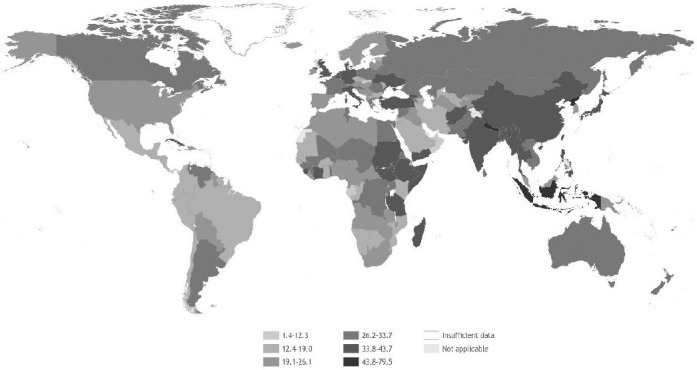
Figure 3.

Death rates (per 100 000 working-age population, ie, age ≥15 years) in 2016 from the 41 pairs of occupational risk factors and health outcomes. Source: WHO and ILO (20).

Death rates (per 100 000 working-age population, ie, age ≥15 years) in 2016 from the 41 pairs of occupational risk factors and health outcomes. Source: WHO and ILO (20).