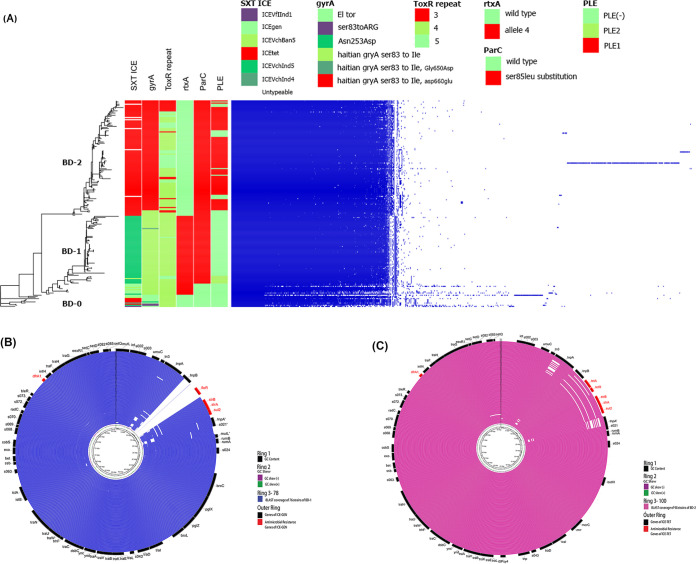
FIG 4.
Pangenome analysis showing differences in the abundance of gene clusters among the lineages. (A) Relative gene abundance of lineages identified by Roary. Features of the sequences are shown with bars and details for features listed in Table S1. (B) BLAST coverage of SXT regions of BD-1 isolates compared with ICE-GEN. Rings represent sequentially outwards following Table S1. Outermost ring shows the different genes of ICE-GEN. (C) BLAST coverage of SXT regions of BD-2 isolates compared with ICE-TET. The rings represent strains of BD-2 sequentially outwards following Table S1. The outermost ring shows different genes of ICE-TET.

