
FIG 1.
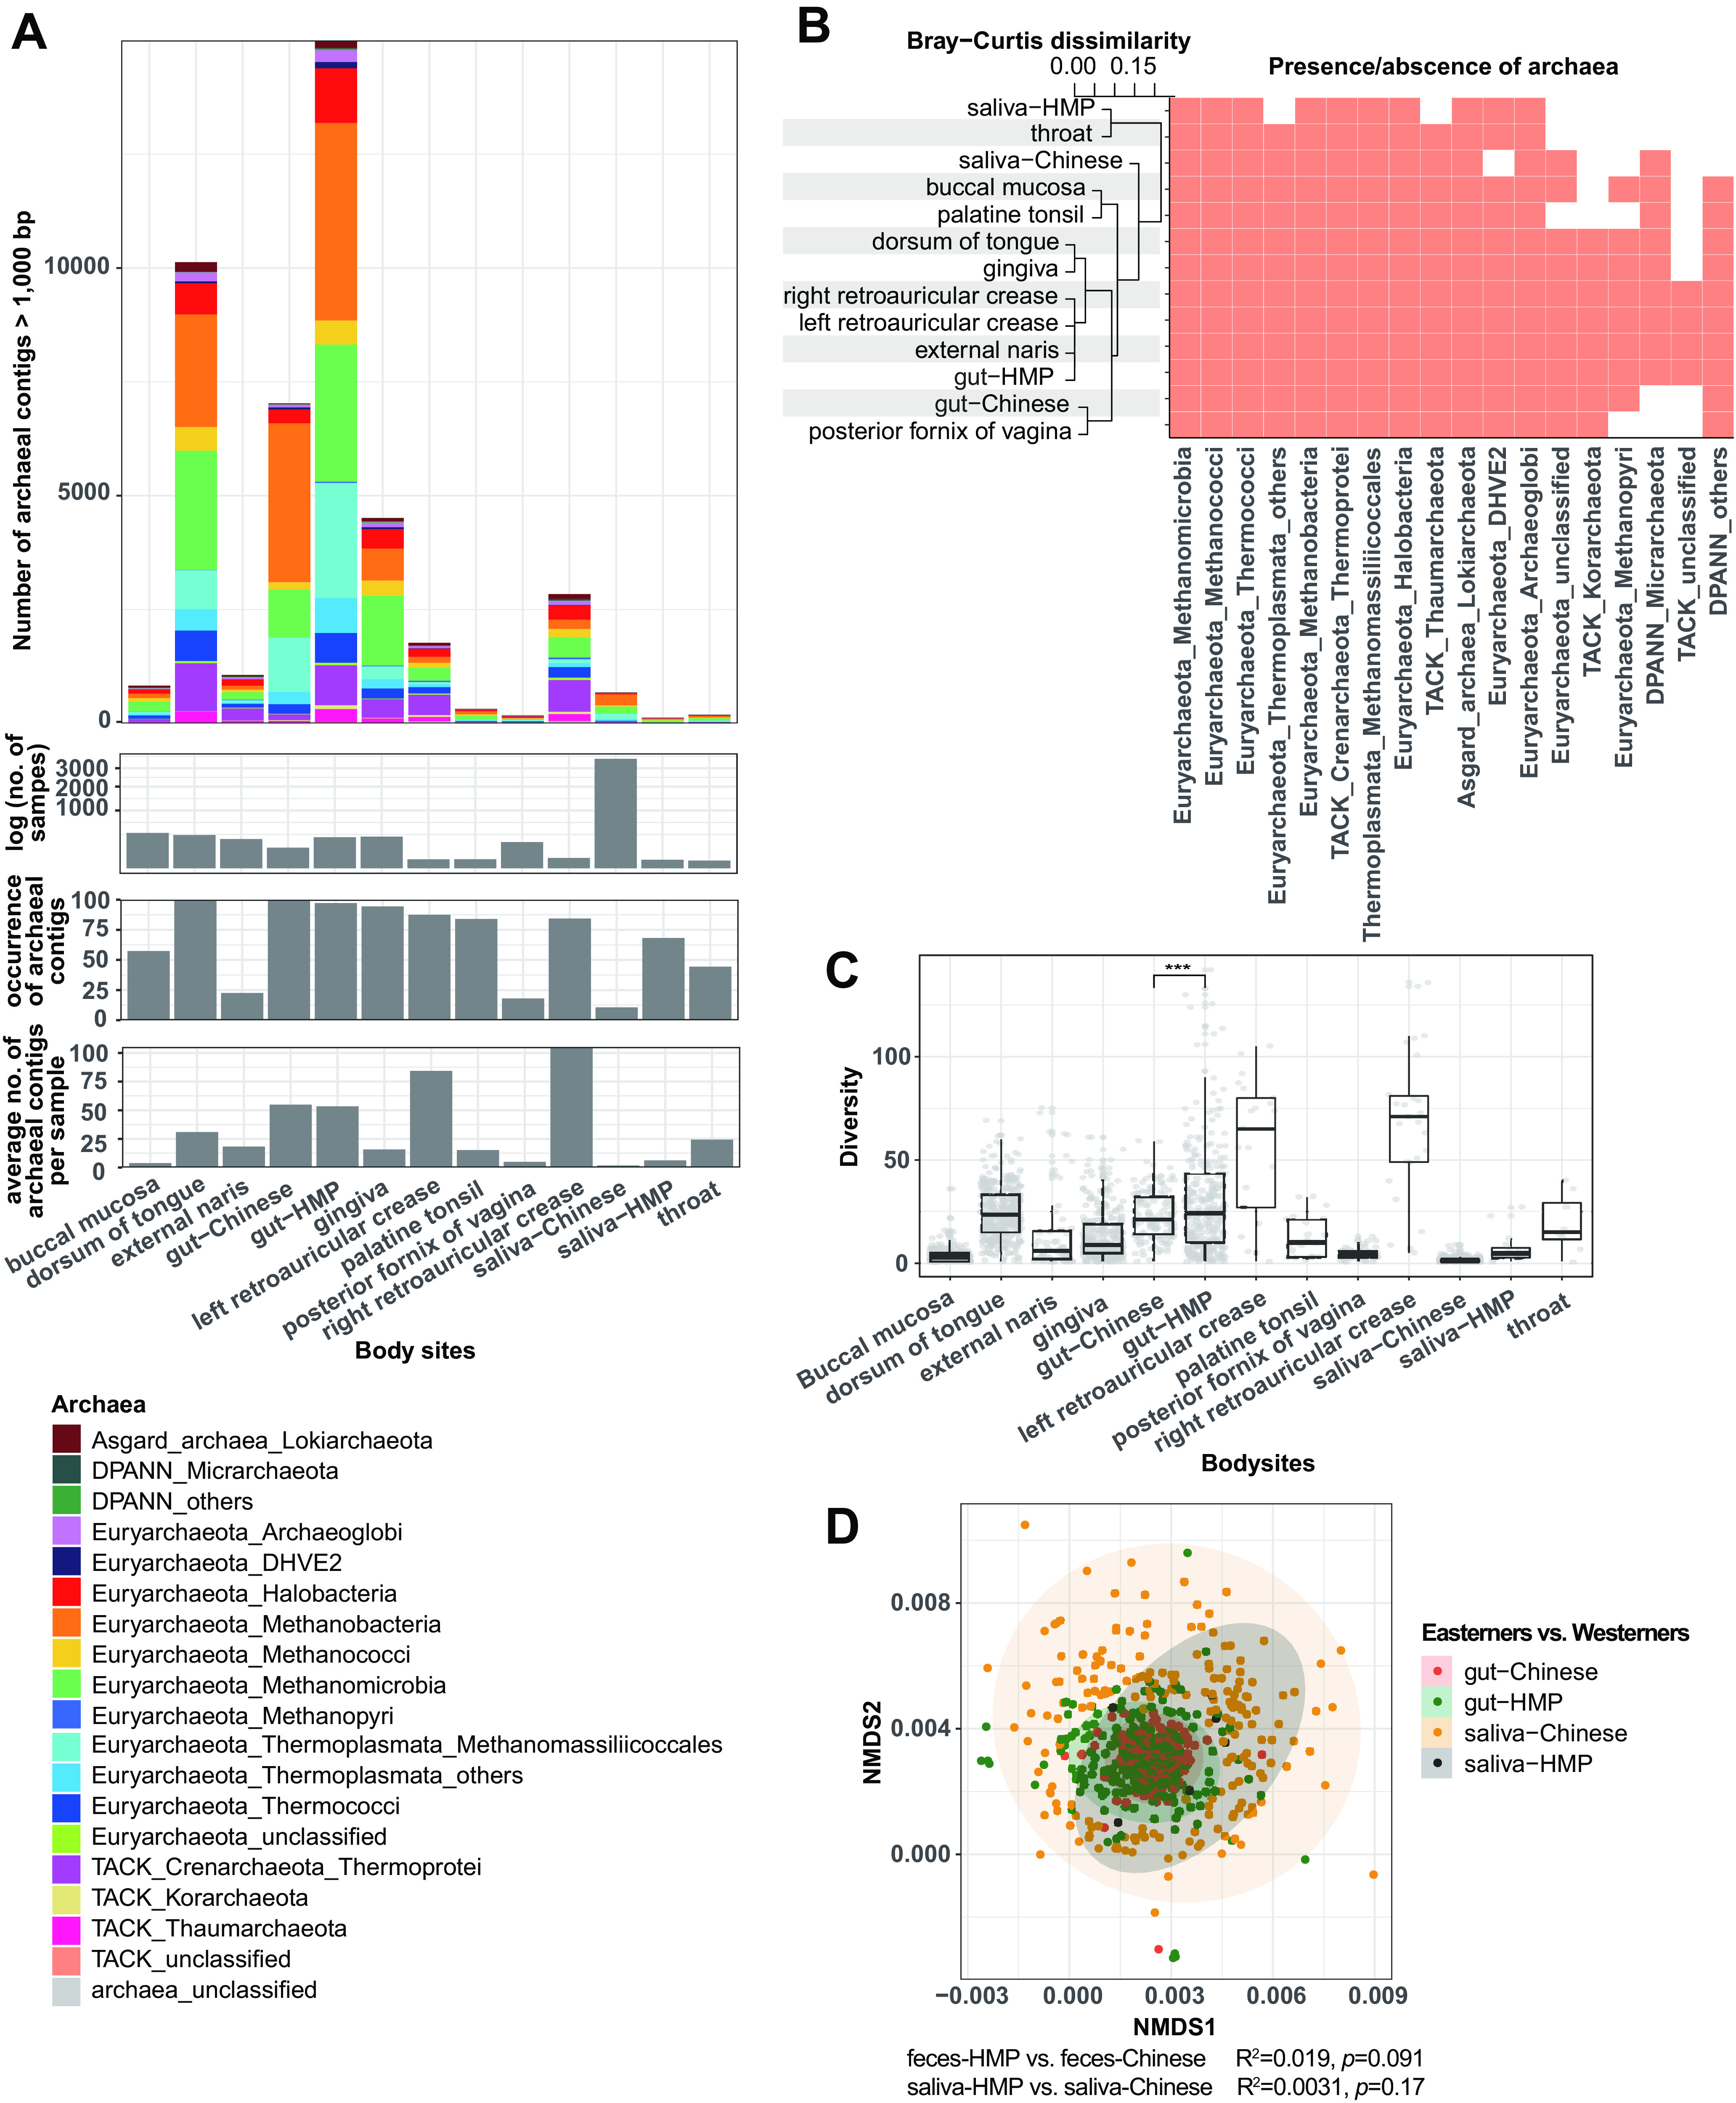
Diversity and distribution of archaea in humans. (A) Number of different archaeal contigs (>1,000 bp) in each body site. The bottom three histograms summarize the total number of samples used for analysis, occurrence of archaeal contigs, and average number of archaeal contigs per sample, respectively. (B) Presence/absence of archaea and their Bray-Curtis dissimilarity across body sites at the species level. (C) Diversity of archaea across different body sites at the species level. ***, P < 0.001. (D) NMDS analysis of the archaea composition at different body sites.