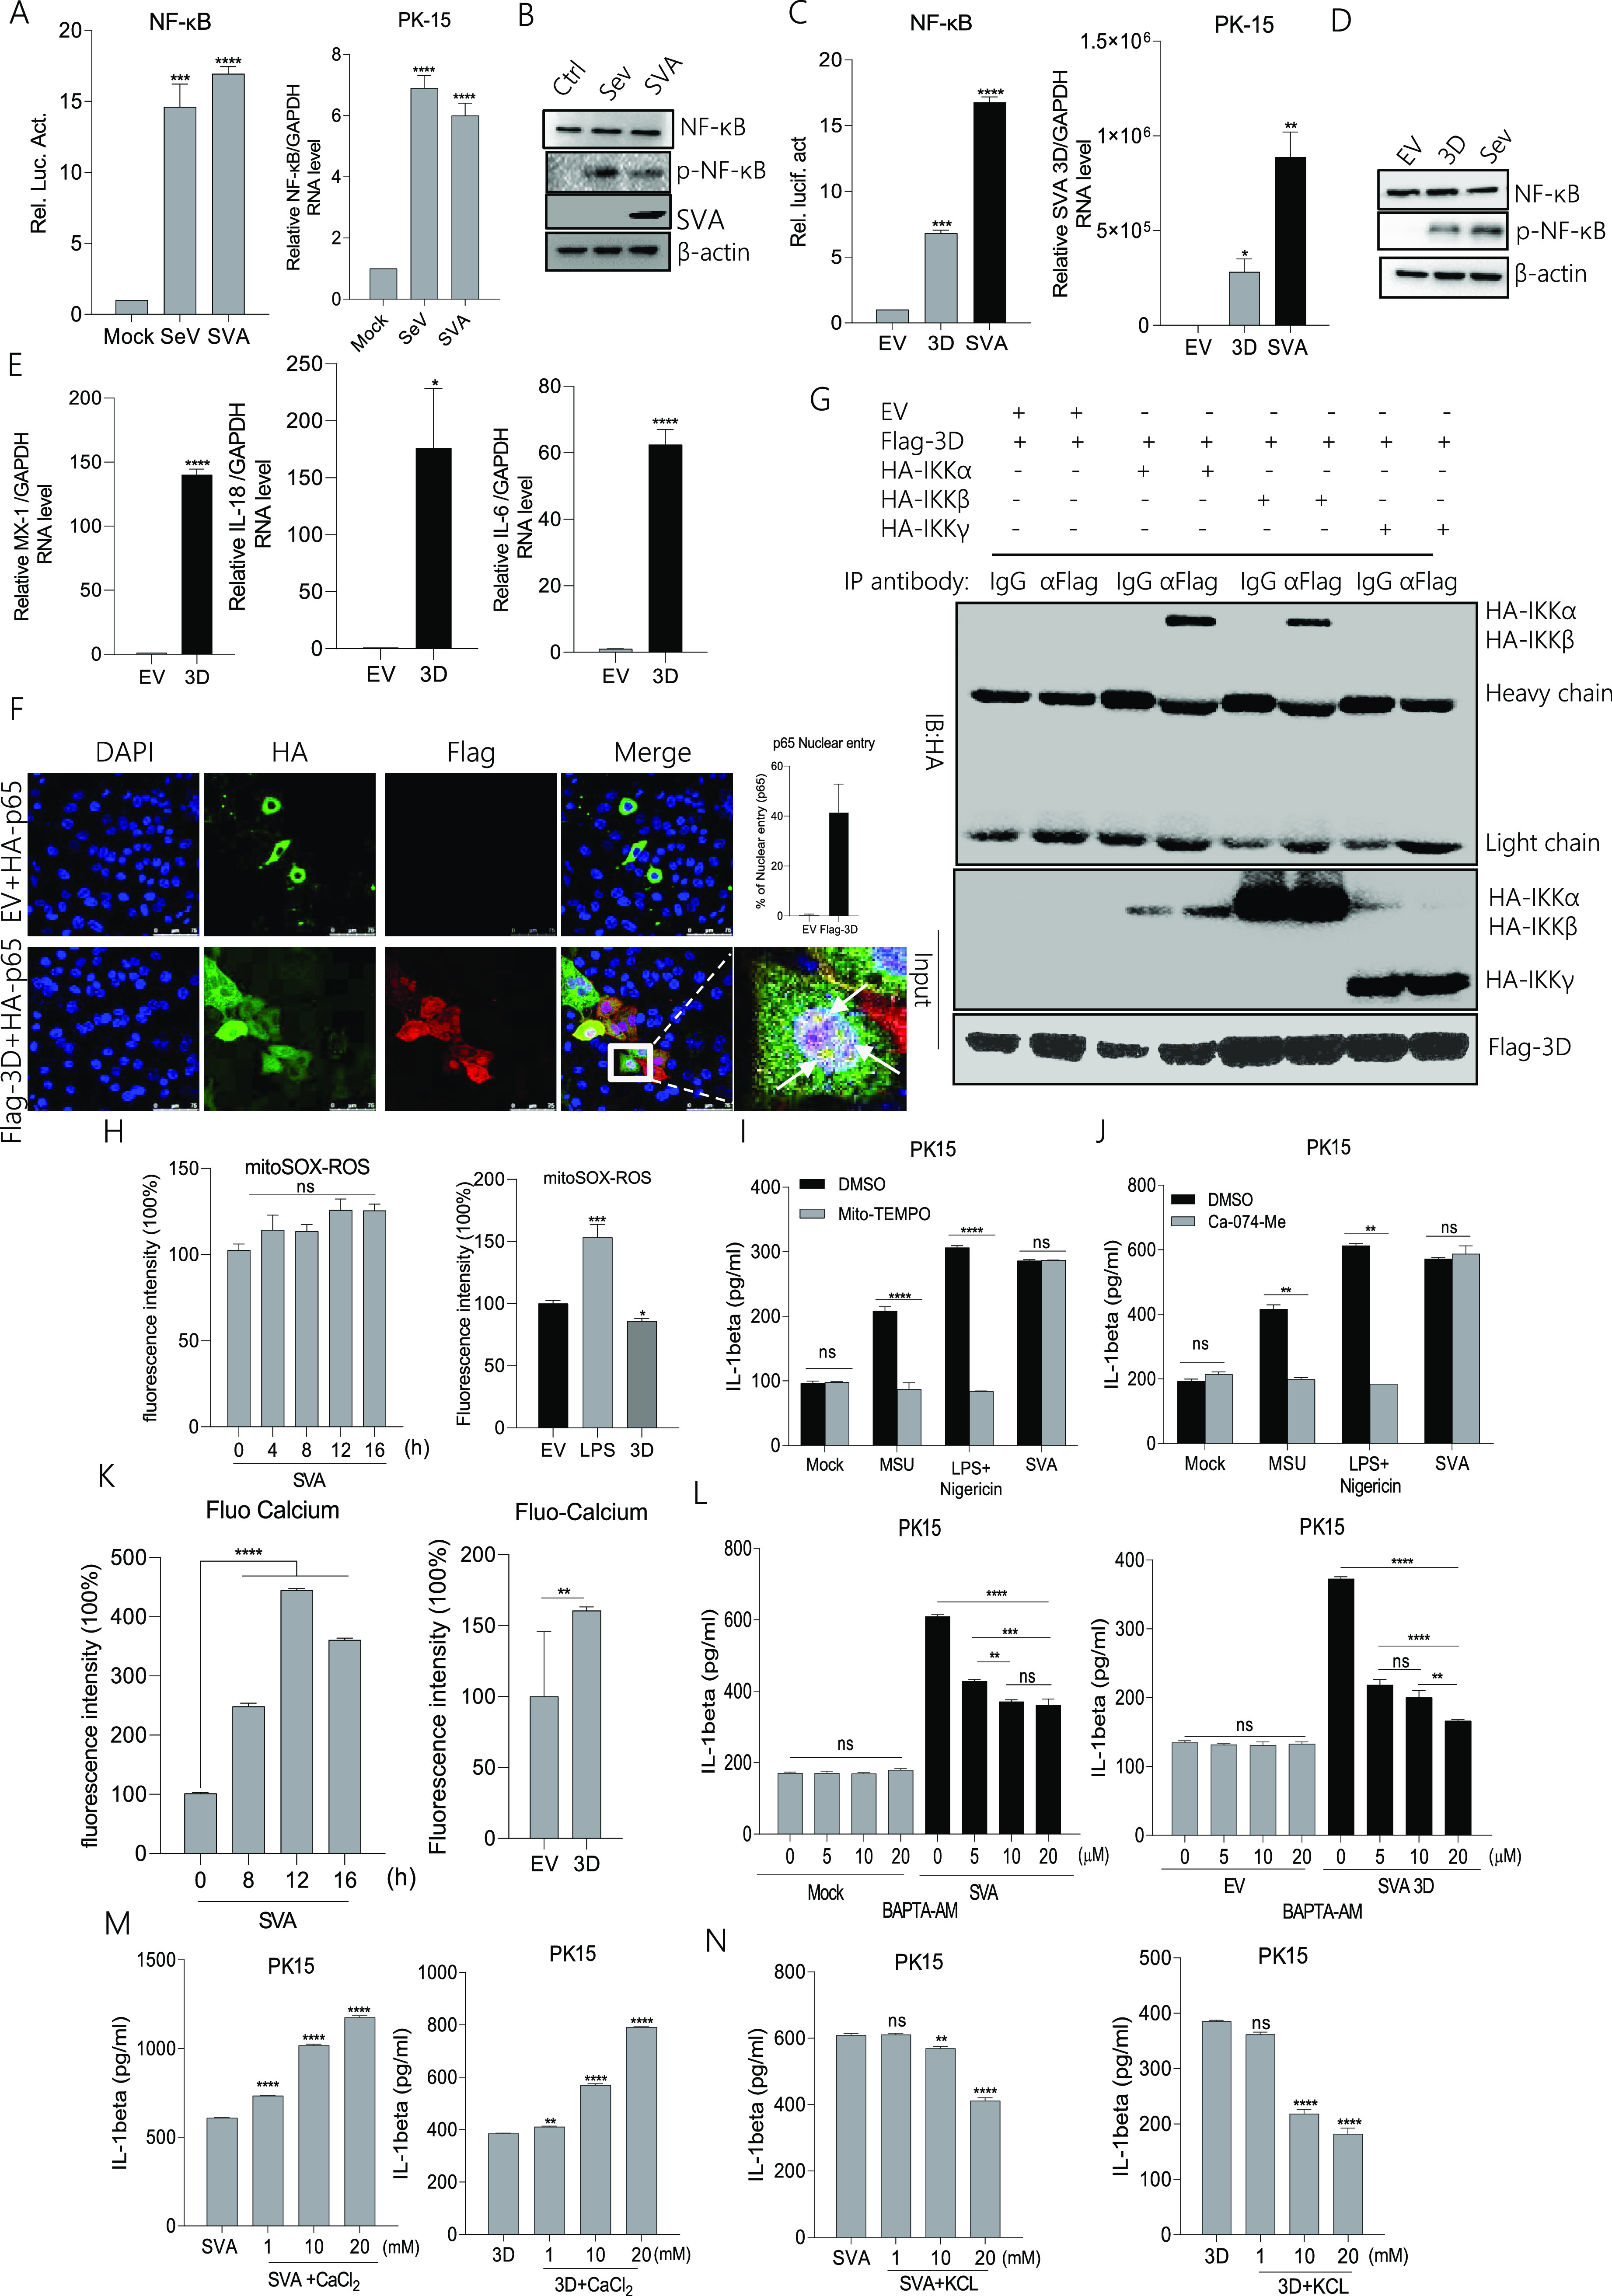
FIG 7.

SVA 3D-induced NLRP3 activation depends on the NF-κB pathway and ion channels (A, C) PK-15 cells were transfected with 2 μg of NF-κB luciferase reporter plasmid (A) or together with 2 μg of 3D (C); after 24 h, cells were infected with SeV or SVA, and controls were kept uninfected. The cell lysates were subjected to a dual-luciferase assay. (A to D) PK-15 cells were infected with SeV or SVA or transfected with 2 μg of EV or 3D. NF-κB mRNA levels and SVA 3D mRNA levels were detected by qPCR (A, C), and NF-κB (P65) and p- NF-κB (P-P65) proteins were detected by Western blotting (B, D). (E) PK-15 cells were transfected with 2 μg of Flag-3D or empty vector pcDNA 3.1, MX-1, IL-18, and IL-6 levels were determined by qPCR. (F) PK-15 cells were transfected with EV+ HA-p65, Flag-3D+ HA-p65. Subcellular localization was observed by confocal microscopy, and the scale bar was 75 μm. (G) PK-15 cells were transfected with 5 μg Flag-3D along with the 5 μg HA-IKKα, HA-IKKβ, and HA-IKKγ. Cell lysates were subjected to IP using IgG, anti-HA, or anti-Flag primary antibody and detected with Western blotting using the indicated antibody (WB). The protein samples as input were subjected to Western blotting. (H) PK-15 cells were infected with SVA or transfected with 2 μg 3D were treated with 5 μM mito-SOX for 10 min at 37°C. The cell lysates were collected at the indicated time points, and the fluorescence intensity was analyzed by flow cytometry. A total of 40,000 cells were counted. (I to J) PK-15 cells were treated or untreated with MSU (2.5 mM), LPS (60 ng/mL)+Nigericin (2 μM), and SVA in the presence of DMSO, Mito-TEMPO (500 μM), or Ca-074-Me (10 μM). IL-β levels were determined by ELISA. (K) PK-15 cells were infected with SVA or transfected with 2 μg of 3D and treated with 1 μM Fluo-3 AM for 1 h at 37°C. The cell lysates were collected at the indicated time points, and the fluorescence intensity was analyzed by flow cytometry. A total of 40,000 cells were counted. (L to N) PK-15 cells infected with SVA or transfected with 3D were treated with BAPTA-AM, CaCl2, or KCl at the indicated doses. IL-β levels were determined by ELISA. After transfection, samples were harvested for 24 h. For Western blot, the antibody dilution ratio was 1:1,000. Data are presented as the mean ± s.e.m. of triplicate measurements in three independent experiments. ns: not significant, *, P < 0.05; **, P < 0.01; ***, P < 0.001; ****, P < 0.0001 vs EV, mock or SVA (one-way ANOVA with Tukey’s post hoc test). The results were analyzed by flow cytometric analysis with FlowJo software V10.
