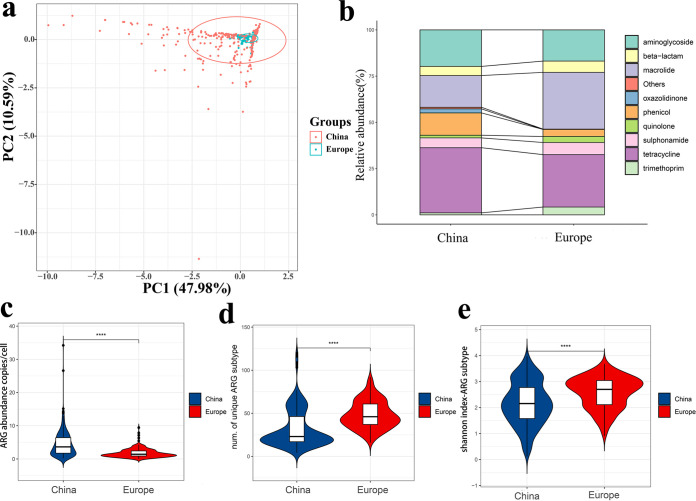
FIG 1.
ARG composition structure distribution. (a) PCA plots showing the ARG subtypes composition differences among the 618 chicken gut samples. (b) Comparison of ARG types in China and Europe. (c) ARGs abundance comparison. (d) Diversity of ARGs subtypes. (e) ARGs subtype of Shannon's Diversity Index.

