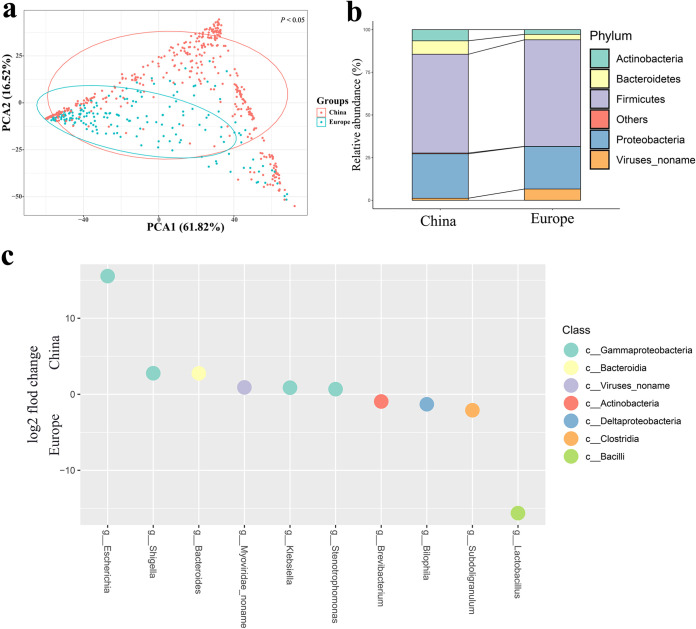
FIG 3.
Bacterial population structure distribution. (a) PCA plots showing the Bacterial flora (genus level) composition differences among the 618 chicken gut samples. (b) Comparison of bacterial flora in China and Europe. (c) Differentially abundant bacteria. Differences in genus abundance between China and Europe. The y axis represents the log2 fold change and the x axis represents the genus name.

