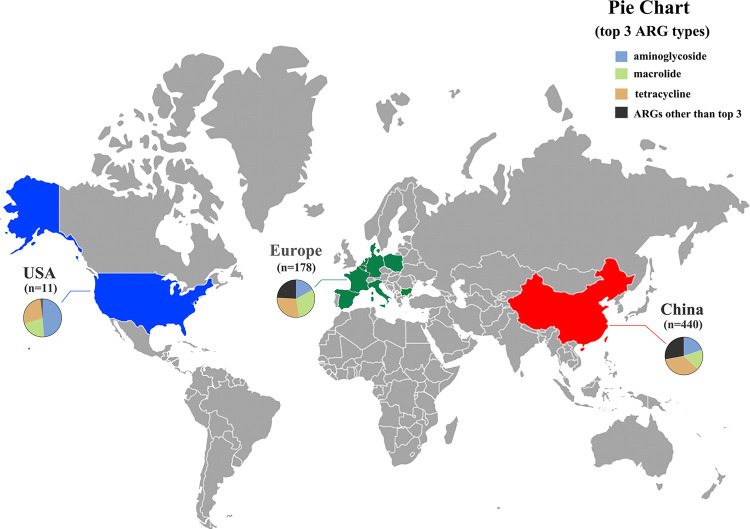
FIG 7.
Distribution map of chicken gut samples and diversity of ARGs, pie chart showing the profile of ARG abundance (top 3 ARG types). Europe (n = 178) includes Netherland s(n = 20), Germany (n = 19), France (n = 20), Spain (n = 20), Belgium (n = 20), Italy (n = 20), Poland (n = 20), Denmark (n = 20), and Bulgaria (n = 19). The map was created using the generator at https://pixelmap.amcharts.com/.

