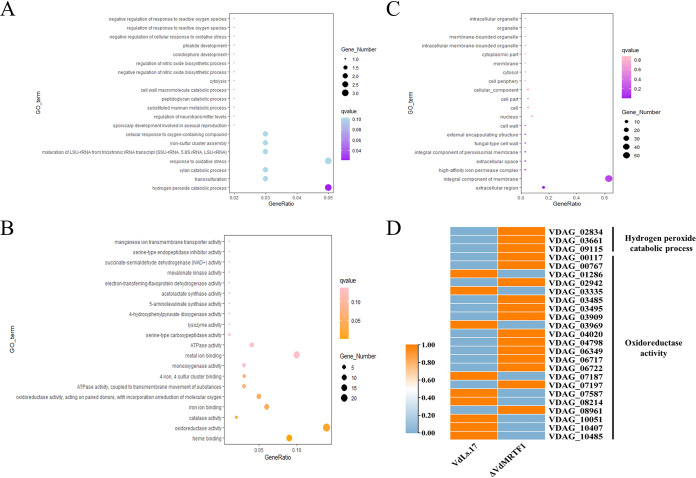
FIG 6.
The gene ontology (GO) enrichment analysis of DEGs in wild-type and ΔVdMRTF1 strains of Verticillium dahliae. (A) Bubble chart showing DEGs enriched in biological process of GO terms. The size of the bubbles represents the gene number of DEGs of each GO term. The x axis indicates the gene ratio, and the y axis indicates the GO terms. (B) Bubble chart showing DEGs enriched in molecular function of GO terms. The size of the bubbles represents the gene number of DEGs of each GO term. The x axis indicates the gene ratio, and the y axis indicates the GO terms. (C) Bubble chart showing DEGs enriched in cellular component of GO terms. The size of the bubbles represents the gene number of DEGs of each GO term. The x axis indicates the gene ratio, and the y axis indicates the GO terms. (D) Heatmap of DEGs in hydrogen peroxide catabolic process and oxidoreductase activity. The date was based on the average FPKM value of three biological repetitions, and TBtools was used to normalize data and generate heat maps. The orange color indicates relatively higher FPKM value, while the light blue color indicates relatively lower FPKM value.

