FIG 8.
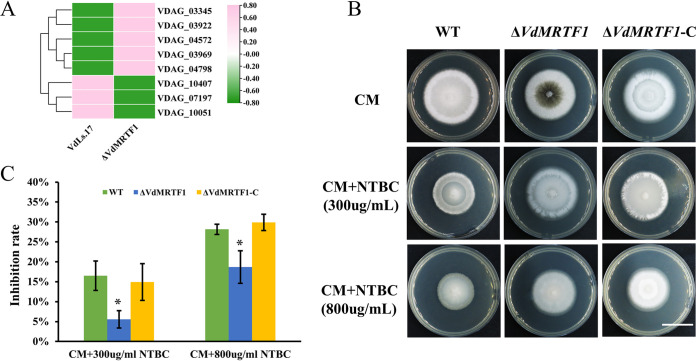
VdMRTF1 regulates tyrosine metabolism in Verticillium dahliae. (A) Heatmap of DEGs in tyrosine metabolism enriched in the KEGG pathway analysis. TBtools was used to normalize data and generate a heat map based on the average FPKM value of three biological repetitions. The pink color indicates relatively higher FPMK, while the green color indicates relatively lower FPMK. (B) The wild-type, ΔVdMRTF1, and ΔVdMRTF1-C strains were cultured in CM, CM with 300 μg/mL, and CM with 800 μg/mL NTBC 2-(2-nitro4-trifluoromethylbenzoyl)-cyclohexane-1, 3-dione) at 25°C for 10 days. Photographs were taken at 10 dpi. Bar, 2 cm. (C) Bar chart of the inhibition rate of the above-described plates. Error bars represent the standard deviations based on three independent replicates. Asterisks indicate significant differences (*P < 0.5).

