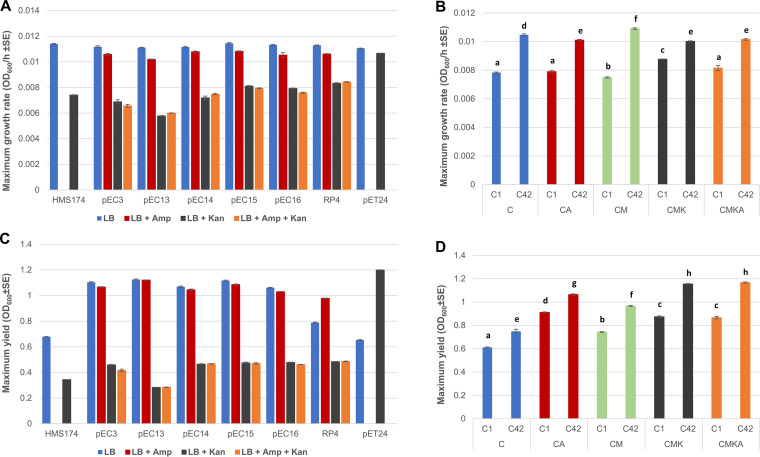
FIG 2.
Maximum growth rates and maximal optical density (600 nm) of cultures of each individual strain (A and C) and communities under different treatments at the start and end of the experiment (B and D). Maximum growth rate indicates a maximum change in optical density in 1 h during the 24-h measurement. C1 and C42 refer to the serial culture experiment after day 1 and day 42, respectively. Statistical difference of growth rates and optical density was determined using two-way ANOVA (P < 0.05). The growth rate for the CMK communities at the starting point was the highest (P < 0.01, 2-way ANOVA; post hoc test, Tukey HSD), whereas no difference in the growth rate was shown between C, CA, and CMKA (P = 0.067, 2-way ANOVA; post hoc test, Tukey HSD). At the endpoint, significant difference was observed among all treatments (P < 0.01, 2-way ANOVA; post hoc test, Tukey HSD) (B). Optical densities of the communities at the endpoint were higher than at the starting point between all treatments (P < 0.01, 2-way ANOVA; post hoc test, Tukey HSD) (D). Different letters indicate statistically significant differences in results.

