
FIG 1.
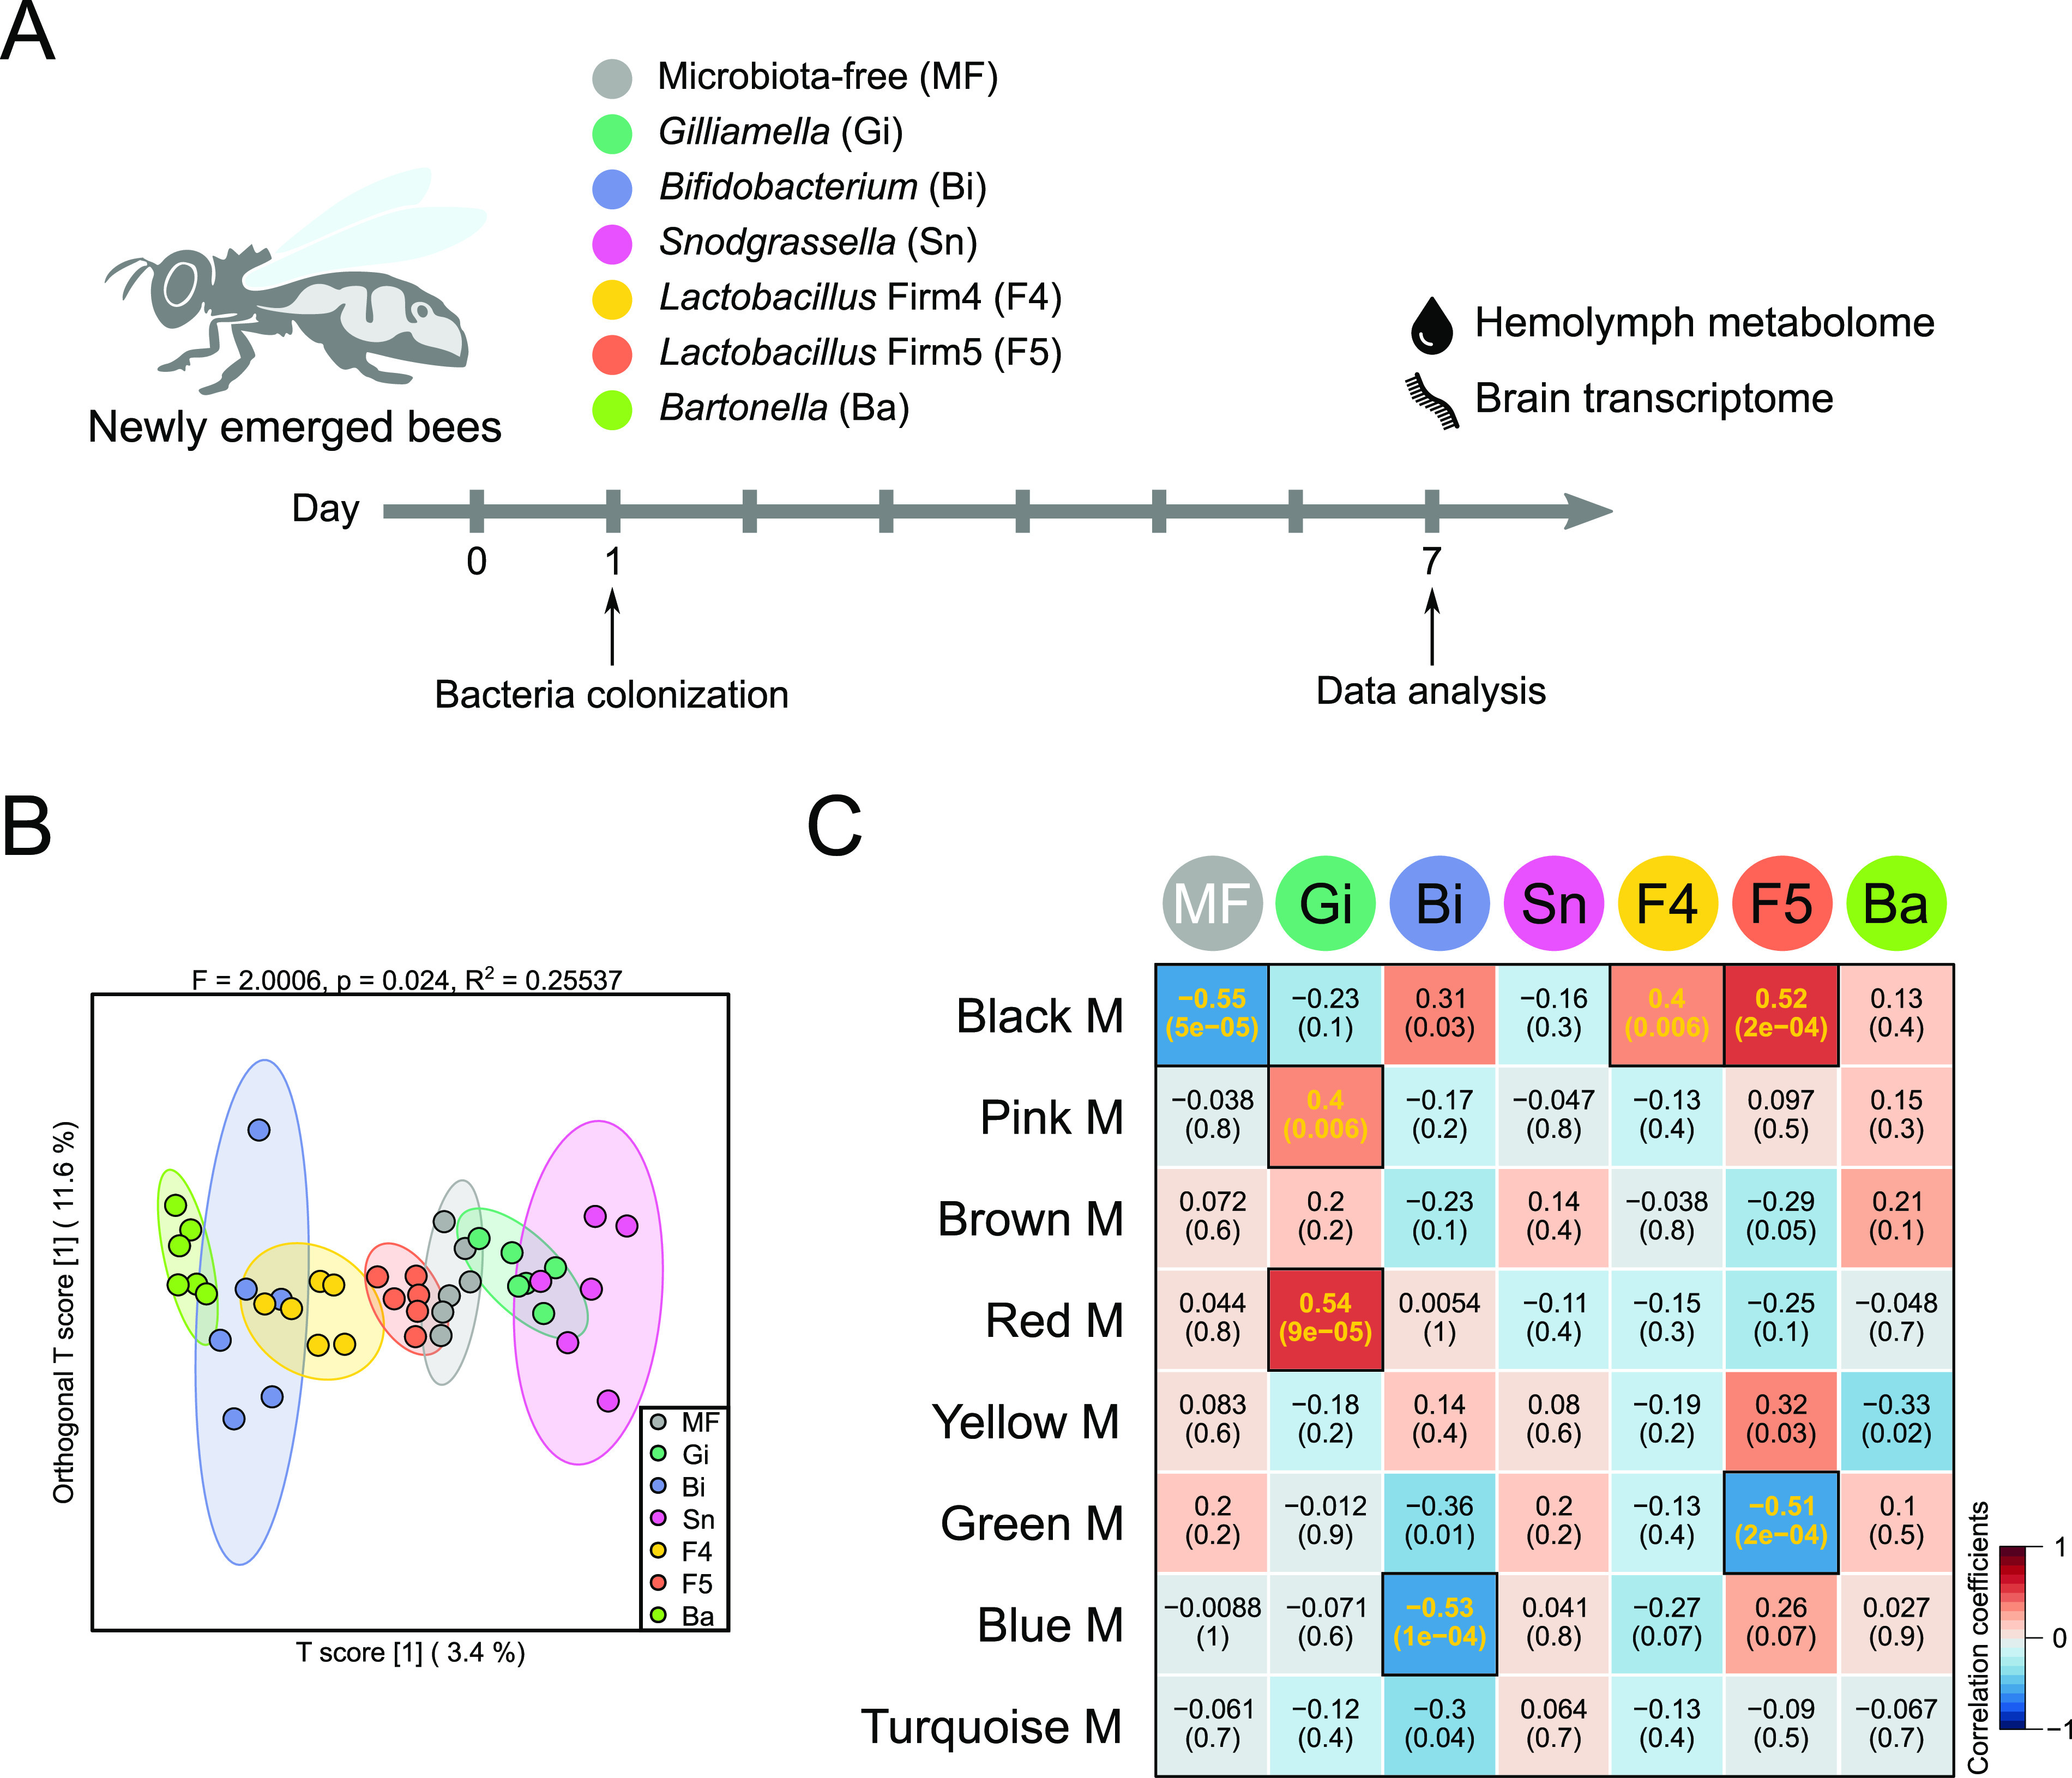
Hemolymph metabolome influenced by different honeybee gut community members. (A) Experimental design: newly emerged bees were either kept microbiota-free (MF) or mono-colonized with one bacterial isolate of each of the six species separately. Hemolymph and brain samples were collected for further analysis on day 7. (B) Orthogonal partial least squares discriminant analysis (OPLS-DA) based on all metabolites detected in the hemolymph of bees. Group differences were tested by permutational multivariate analysis of variance (PERMANOVA). (C) Weighted correlation network analysis identified eight modules (M) of metabolites highly correlated with different bee groups. Color names represent metabolite modules assigned by the WGCNA pipeline. Heatmap colors indicate positive/negative Spearman’s correlation coefficients. Correlation coefficients and P values are shown within the squares (yellow font, P < 0.01). Gi, Gilliamella apicola; Bi, Bifidobacterium asteroides; Sn, Snodgrassella alvi; F4, Lactobacillus Firm4; F5, Lactobacillus Firm5; Ba, Bartonella apis.