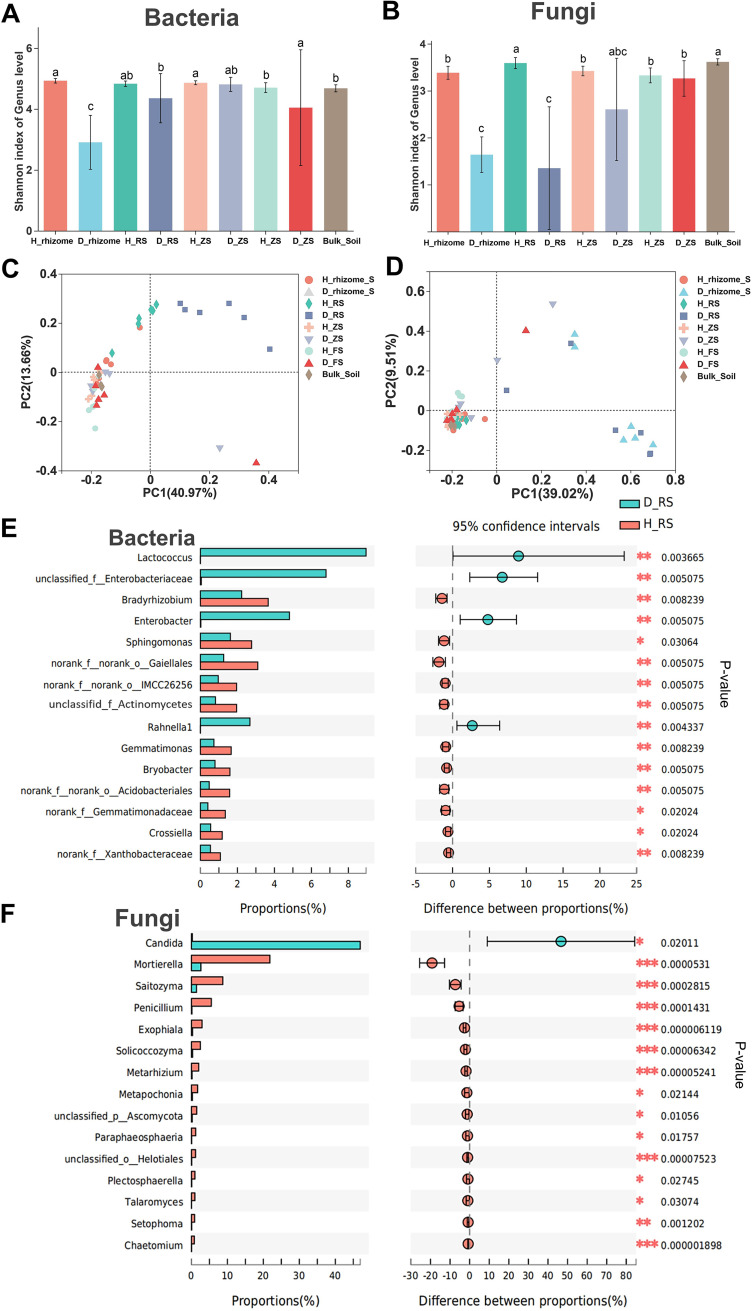
FIG 4.
Bacterial and fungal community and differential analysis of all healthy and diseased plant samples. (A and B) Alpha-Shannon diversity indices of bacterial (A) and fungal (B) communities of all soil samples; n = 27, Student’s t test. (C and D) PCA of bacterial and fungal community beta diversity of all samples (healthy rhizome versus diseased rhizome, ANOSIM; bacterial: R = 0.96, P = 0.003; fungal: R = 0.93, P = 0.003) to a larger extent than that in the rhizosphere (healthy versus diseased rhizosphere, ANOSIM; bacterial: R = 0.36, P = 0.003; fungal: R = 0.62, P = 0.003; on average, respectively); healthy versus diseased plant, ANOSIM; zone and furrow bacterial: R = 0.01, P = 0.385/R = −0.04, P = 0.674; fungal: R = 0.13, (P = 0.054/R = 0.1, P = 0.1564; on average, respectively). (E and F) Significance test between healthy and diseased rhizosphere soil bacterial and fungal community groups; Wilcoxon rank sum test.

