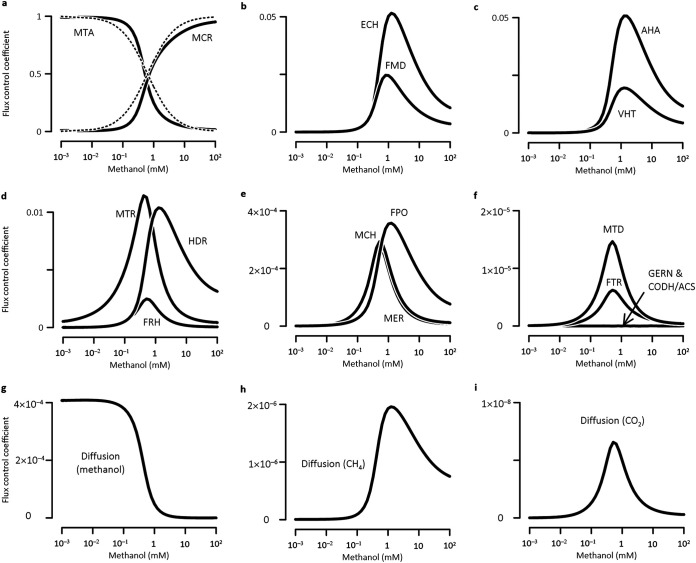
FIG 4.
Scaled flux control coefficients of different enzymes (a to f) and diffusion processes (g to i) vary with ambient methanol concentrations to different extents. Solid lines are the results of MCA; dashed lines represent the conditions (equations 9 and 10) under which growth rate follows the Monod equation (equation 1). See the Fig. 1 legend for definitions of abbreviations.

