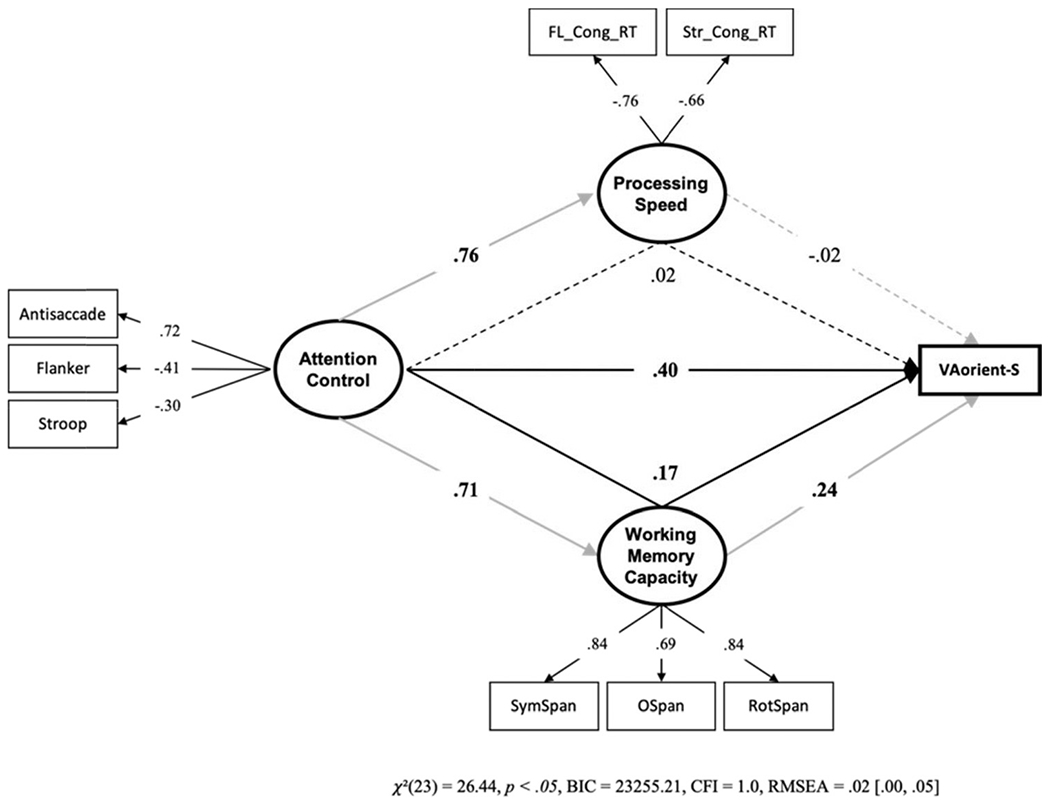
Figure 11. Structural Equation Model With Processing Speed and Working Memory Capacity Mediating the Attention Control – VA-Orient-S Relationship.

Note. FL_Cong_RT = mean reaction time on congruent trials in the Flanker task; Str_Cong_RT = mean reaction time on congruent trials in the Stroop task. We multiplied the FL_Cong_RT and Str_Cong_RT values by −1 to reflect shorter reaction times as higher processing speed. To make this evident in the figure, the loadings onto the processing speed factor are shown to be negative. Dotted lines represent paths that were not statistically significant, p > .05. VA = visual arrays. Bold numbers indicate significant values based on p < .05. The indirect effect through working memory capacity, but not processing speed, was statistically significant.
