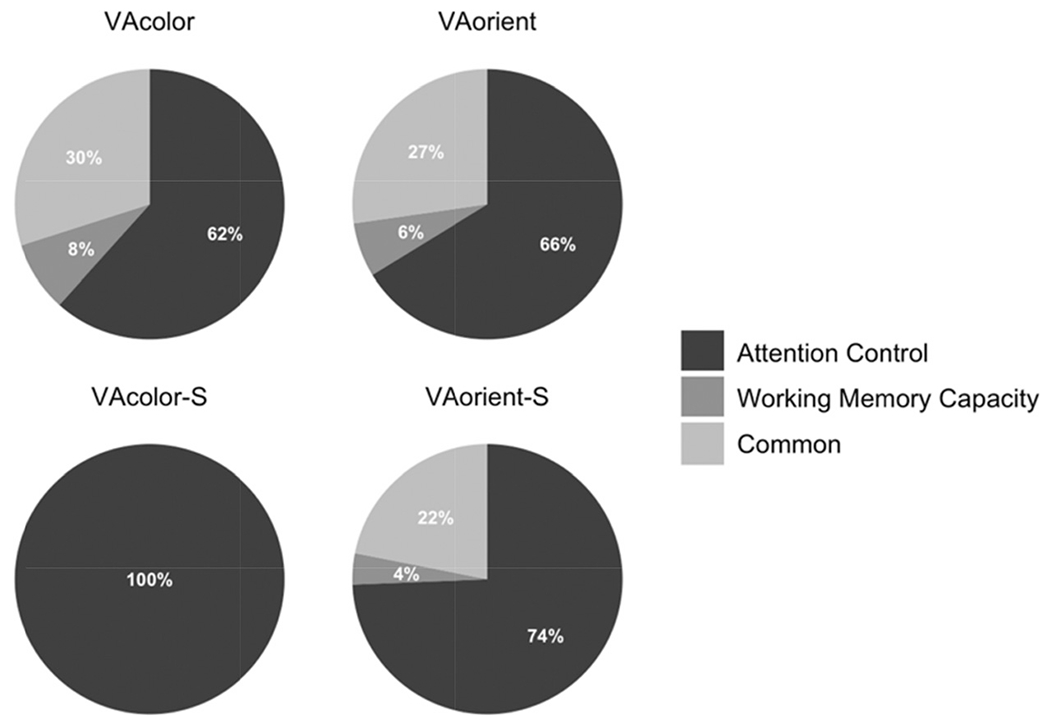
Figure 17. Pie Chart Representing the Unique Contributions From Working Memory Capacity/Attention Control and Common Variance Between the Two.

Note. The model explained 35% of variance in the VA-color task, 34% of variance in the VA-orient task, 35% of variance in the VA-color-S task, and 42% of variance in the VA-orient-S task. VA = visual arrays.
