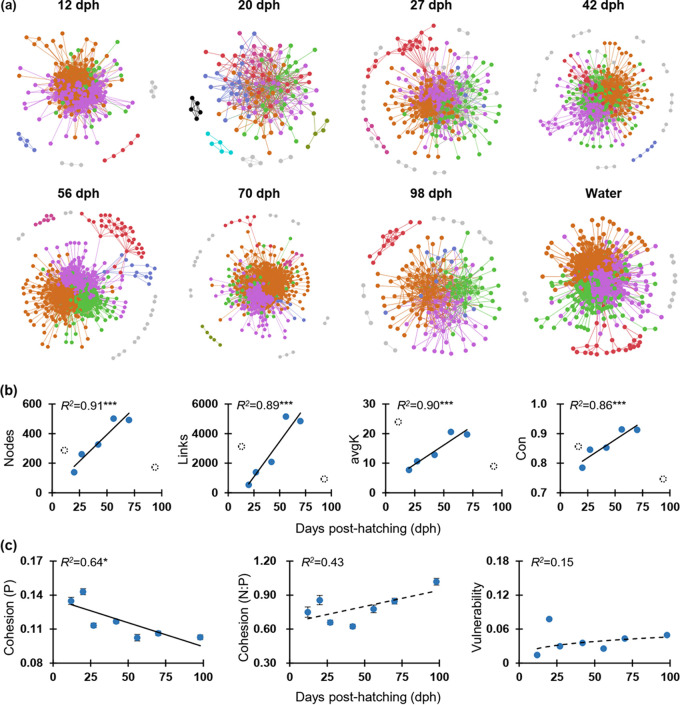
FIG 2.
Succession and stability of gut microbial networks across zebrafish development (only for sampling points with ≥ 27 replicates). (a) Visualization of constructed molecular ecological networks generated using the Molecular Ecological Network Analysis (MENA) pipeline based on OTU relative abundances of gut microbiota. Each node represents 1 OTU, and each link represents a correlation between a pair of nodes. Large network modules (≥ 5 nodes) are shown in different colors, and smaller modules (2 to 4 nodes) are shown in gray. Details of network topological attributes are listed in Table S2. (b) Development-dependent changes of network topology included nodes, links, average degree (avgK), and connectedness (Con). In each panel, filled symbols represent networks involved in the significant (P < 0.05) linear regression as shown by the solid line (including 20, 27, 42, 56, and 70 dph), and dotted open symbols represent those that were non-significant (P > 0.05). The adjusted R2 are given together with the corresponding P values (*** P < 0.001). (c) Network stability, as visualized by sampling points, and the adjusted R2 are given together with the corresponding P values (solid lines: * 0.01 < P < 0.05; dotted lines: P > 0.05). The positive cohesion (P) and negative cohesion (N) reflect the magnitude of cooperation and competitive interactions, respectively. A community with a lower value of P or a higher relative fraction of |negative cohesion|: positive cohesion (N:P) indicated a more stable community. The vulnerability reflects how fast the consequence of microbial interactions affect either parts of or the entire network. Generally, a lower network vulnerability suggests a more stable community.

