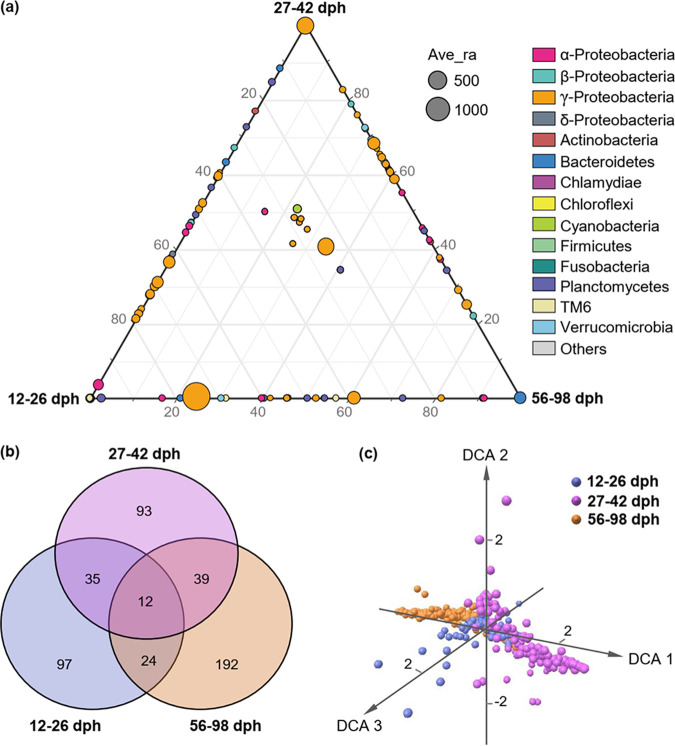
FIG 3.
Distribution traits of the networked communities (assemblages of microbial taxa detected in the stage-dependent networks, and zebrafish development were divided into three stages as referred to in our previous study [5] according to the community patterns of gut microbiota). (a) Ternary plots of all networked OTUs (if an OTU was absent from a network, its abundance was set to 0 in all samples at that stage). Each circle represents an OTU, and its size represents the weighted average abundance. The position of each circle was determined by the contribution of the indicated compartments to the total relative abundance. (b) Venn diagrams showing the number of shared and unique network OTUs among developmental stages. (c) DCA ordination showing the dissimilarity of networked communities among developmental stages.

