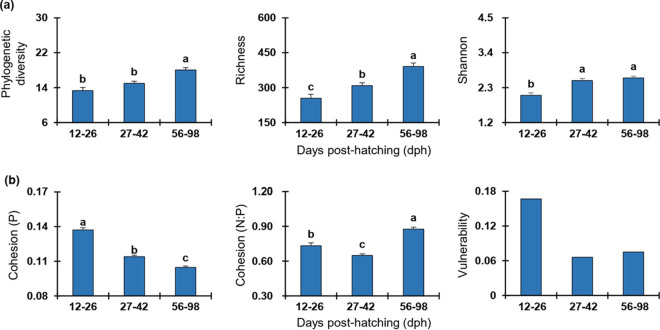
FIG 6.
Variation of diversity and network stability of gut microbiota across zebrafish developmental stages. (a) Alpha diversity as visualized by zebrafish developmental stages. (b) Network stability as visualized by zebrafish developmental stages. Each error bar corresponds to the standard error. The variations among stages were tested through an ANOVA with least-significant-difference (LSD) tests. The presence of different letters denotes significant differences among stages, whereas the same letter indicates no statistical difference. However, the vulnerability of a network is indicated by the maximal vulnerability of nodes in the network. As there is no ANOVA test for the vulnerability, no letters are given for the vulnerability panel. The positive cohesion (P) and negative cohesion (N) reflect the magnitude of cooperation and competitive interactions, respectively. A community with a lower value of P or a higher relative fraction of |negative cohesion|: positive cohesion (N:P) indicates a more stable community. The vulnerability reflects how fast the consequence of microbial interactions affect either parts of or the entire network, and a lower network vulnerability suggests a more stable community.

