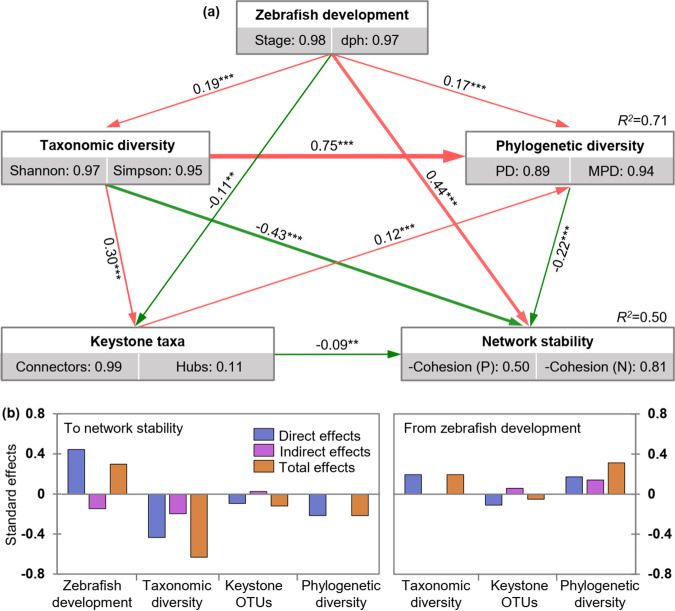
FIG 7.
Effects of the major factors on the network stability as determined by the structural equation model (SEM) analysis. (a) Partial least-squares-path models showing the cascading relationships of different factors. Single-headed arrows indicate the hypothesized direction of causation. Rectangles represent the investigated components, and the numbers in the gray rectangles represent the positive relationship between manifest variables, which indicate that the manifest variables could reflect latent variables as well. Red and green solid lines with arrows indicate significant positive and negative relationships, respectively. The line width is proportional to the strength of the relationship. The numbers associated with arrows represent the direct effects of a latent variable to another latent variable. For example, the direct effect of zebrafish development to network stability is 0.44, and such values were calculated by constructing a reasonable data linear matrix using R packages of “plsmp.” The positive cohesion (P) and negative cohesion (N) reflects the magnitude of cooperation and competitive interactions, respectively. As the communities with lower values of P and N are more stable, their values were multiplied by −1 to make sure the stability retained the same trend with the variation of cohesion. (b) Standardized effects of different factors on the network stability or those from zebrafish development. The effect is called “standard effect” because its value was converted to range between −1 and 1. The direct effects were given by the path coefficients, while the indirect effects were obtained as the result of path coefficients by taking an indirect path. The total effects are the sum of both the direct and indirect effects. Asterisks indicate the statistical significance (*** P < 0.001, and ** 0.001 < P < 0.01); dph, days post-hatching; PD, phylogenetic distance; MPD, mean pairwise distance.

