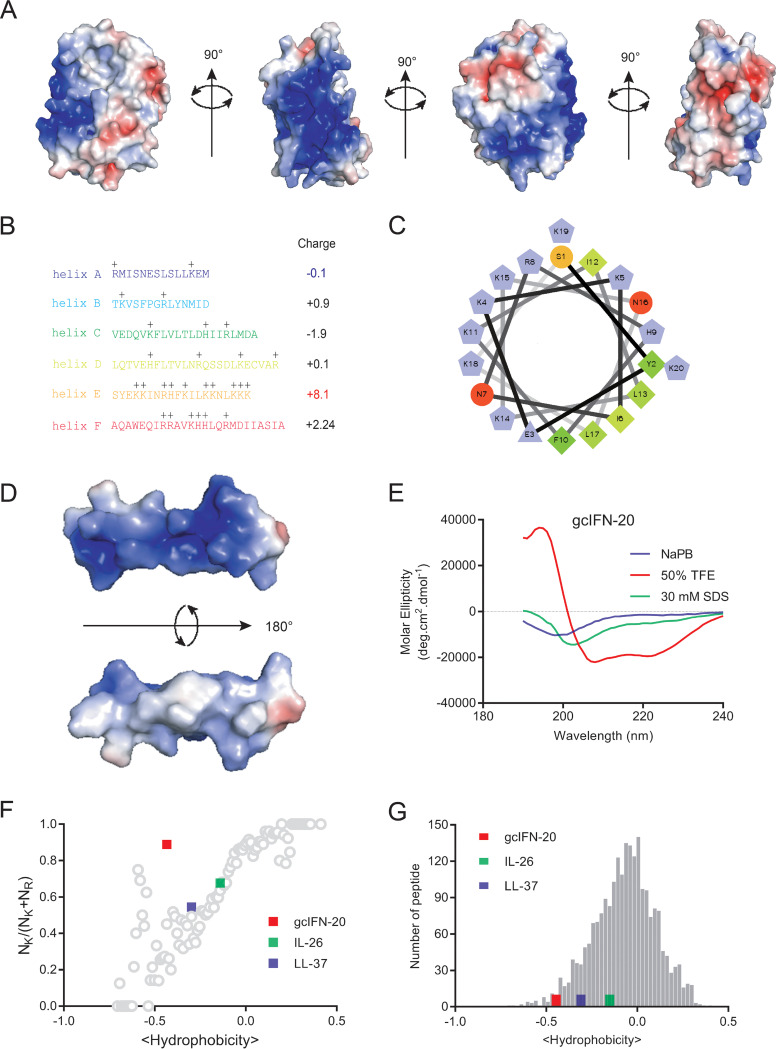
FIG 1.
The structural features of gcIFN-20. (A) Color-coded electrostatic potentials were mapped onto the surfaces of gcIFN1. Areas with positive charges are shown in blue, negative charges are in red, and hydrophobic residues are in white. (B) Amino acid sequences and positive charges in gcIFN1 α-helices. Total net charge of every helix is shown on the right. (C) Helical wheel plot of gcIFN-20 illustrates the facial amphipathicity along the helical axis. Charged hydrophilic residues are in violet (positive residues K, R, H in pentagons and negative residue E in triangle), uncharged hydrophilic residues are in orange (S) and red (N), and hydrophobic residues are in green (F, L, I, Y). (D) Color-coded electrostatic potentials were mapped onto the surface of gcIFN-20. Areas with positive charges are shown in blue, negative charge is in red, and hydrophobic residues are in white. (E) The CD spectra of gcIFN-20 (70 μM) in 50 μM NaPB, 50% TFE, or 30 mM SDS. (F) Relationship between positively charged amino acid residues (NK/[NK + NR]) and average peptide hydrophobicity for 2,237 cationic AMPs in the AMP database (gray circles). Human LL-37 and IL-26 were plotted for references. (G) Comparison of hydrophobicity between gcIFN-20 and AMPs. Histograms depict the distribution of hydrophobicity among the 2,237 cationic AMPs in the AMP database (gray bars). Human LL-37 and IL-26 were presented for references.

