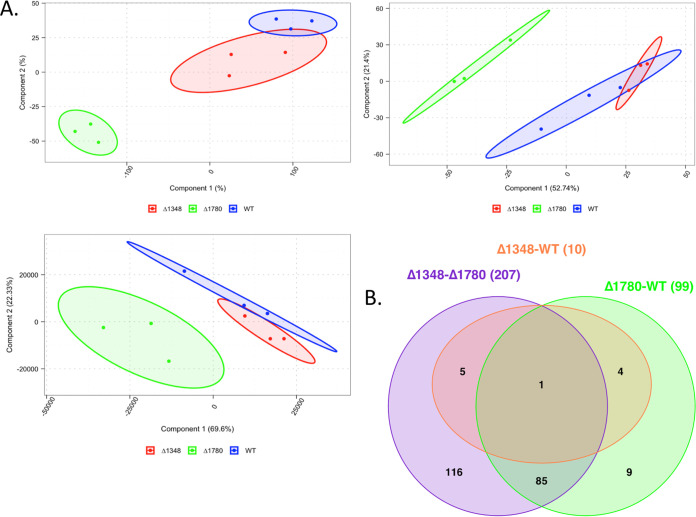
FIG 7.
RNA-Seq overview. (A) Cluster analysis (left, t-distributed stochastic neighbor embedding [t-SNE]; middle, principal-component analysis [PCA]; right, principal-coordinate analysis [PCoA]) of normalized counts consistently demonstrated a separation between W83 ΔPG1780 and both W83 ΔPG1348 and the parent strain W83. This separation was not as strong for the ΔPG1348 mutant and the parent strain, which resulted in an effectively low number of differentially expressed genes in the analysis. (B) Venn diagram shows counts of differentially expressed genes across all three comparisons. As shown in the cluster, comparisons between the ΔPG1348 mutant and the ΔPG1780 mutant and between the ΔPG1780 mutant and the WT yielded 207 and 99 differentially expressed genes, respectively, while only 10 differentially expressed genes were found in the comparison of the ΔPG1348 mutant and the WT.

