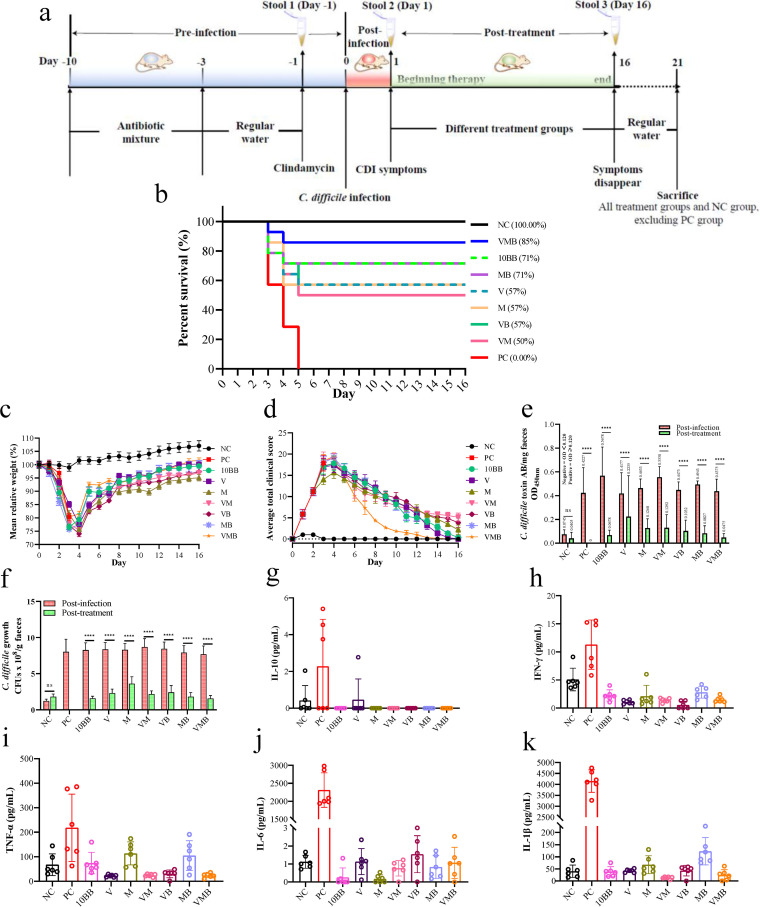
FIG 1.
Therapeutic effects of different groups on primary C. difficile infection (pCDI) mice. (a) Experimental design schematics (total n = 126). (b) Survival rate (%) on day 16. (c) The mean relative weight (day 0 to day 16). (d) The average total clinical scores (day 0 to day 16). (e) Level of toxin A/B presence in the feces of pCDI mice. OD450 nm <0.12 represent negative, OD450 nm ≥0.12 represent positive. The higher the OD value, the higher the toxin content. (f) Isolation of C. difficile from feces of pCDI mice by stool plating in C. difficile moxalactam norfloxacin agar selective medium (CDMN). ns, not significant; ***, P < 0.0001; Dunnett’s multiple-comparison test. Day 16 to day 21 is the observation period after treatment was discontinued. The levels of (g) IL-10, (h) IFN-γ, (i) TNF-α, (j) IL-6, and (k) IL-1β in the different groups on day 21 after the sacrifice except for the PC group. Once mice in the PC group died, their tissues were immediately collected for measurement. One-way analysis of variance (ANOVA) followed by Tukey’s multiple-comparison test; nonshared letters among different groups represent significant differences; P < 0.05; n = 6 per group. Negative-control group (NC, fed normally without intervention), positive-control group (PC, infected by C. difficile without intervention treatment), 1010 CFU/mL of YH68 bacterial suspension (10BB), vancomycin group (V), metronidazole group (M), VAN combined with MTR group (VM), VAN combined with 10BB group (VB), MTR combined with 10BB group (MB), and VAN and MTR combined with 10BB group (VMB).

