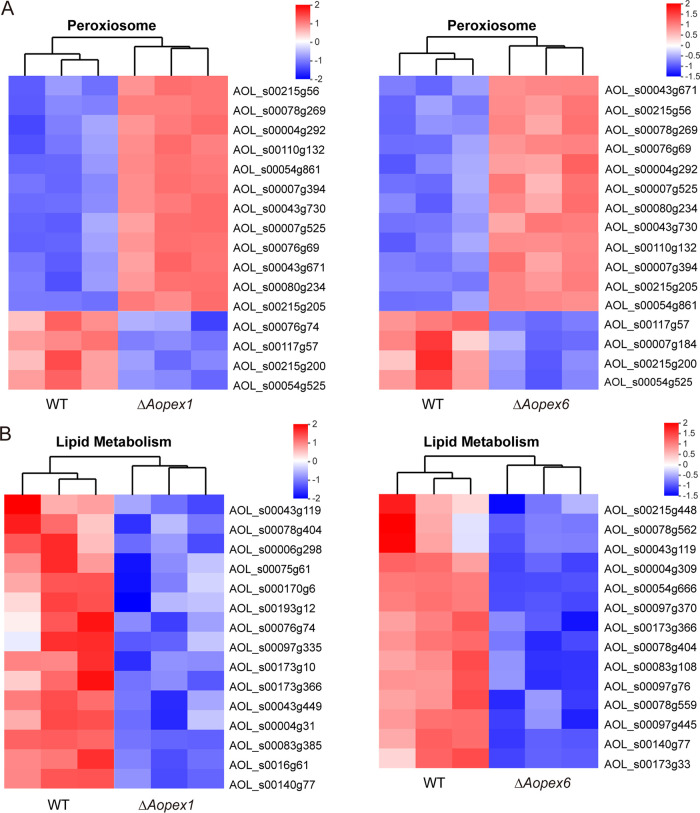
FIG 7.
Differentially expressed genes (DEGs) associated with peroxisome and lipid metabolism. (A) Heat map showing the DEGs involved in peroxisomes. (B) Heat map showing the DEGs involved in lipid metabolism. Gene expression patterns are in log10-scale. Red boxes, upregulated clusters; blue boxes, downregulated clusters.

