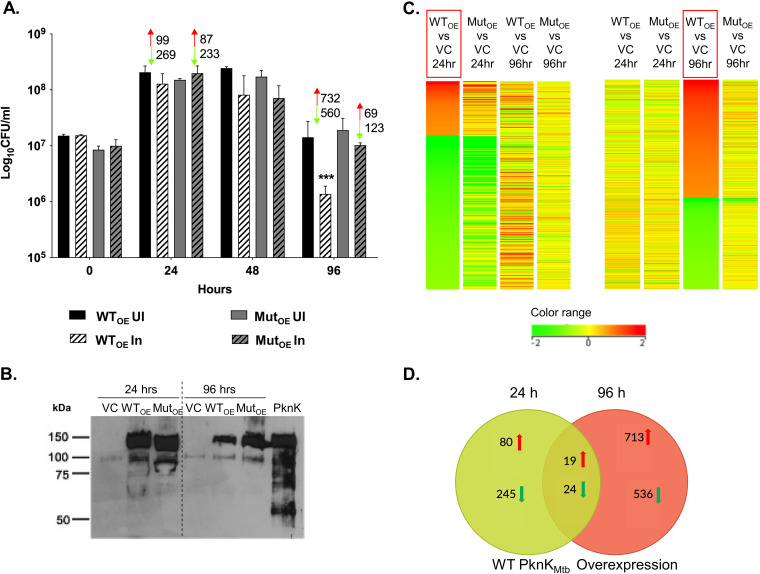
FIG 3.
Characterization of PknK overexpression strains. (A) Growth profile of PknKMtb WTOE and MutOE strains and its correlation with the number of differentially expressed genes from microarray analysis (red indicates upregulation and green indicates downregulation). Viable counts (mean ± SD) from 3 independent experiments are plotted. *** represents P < 0.001 for the decrease in CFU of WTOE at 96 h compared to the empty-vector control. UI, uninduced; In, induced. (B) Immunoblot analysis of VC, WTOE, and MutOE whole-cell lysates at 24 h and 96 h postinduction for PknK levels using rabbit anti-PknK antibody (1:3,000). Purified PknK protein served as a positive control. (C) Heat map of DEGs in WTOE at 24 h and 96 h postinduction (boxed in red). Color bar indicates a range of log2 fold changes of repression (green) and induction (red) from −2 and +2, respectively. (D) Venn diagram highlighting the number of genes in WTOE strains that are unique and common to the 24-h (green circle) and 96-h (red circle) time points. The arrows denote up- or downregulation.

