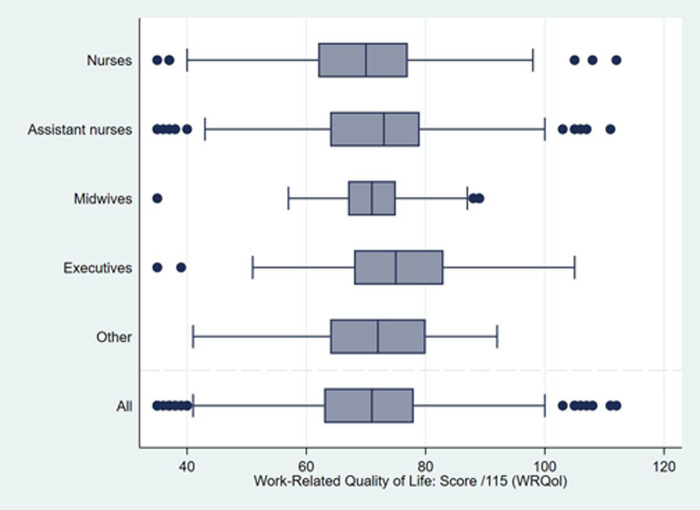
Fig 1. Boxplots of quality of working life scores among night-shift healthcare workers according to their professional category (n = 1,387, AP-HP ALADDIN survey, Paris public hospitals).
The boxplots present median values and interquartile ranges (box) for the full-scale WRQoL score (range 0 to 115). Lines (whiskers) include all points within 1.5 interquartile range of the nearest quartile. Higher score values denote better QWL.

