
Figure 1.
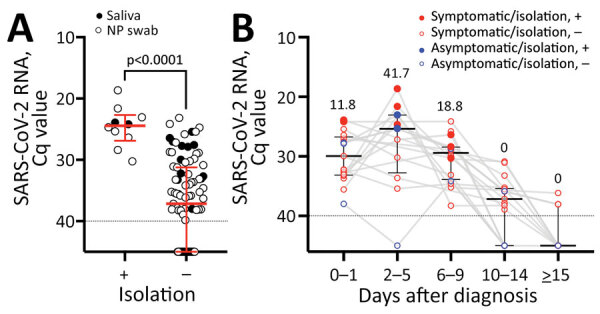
SARS-CoV-2 RNA level and infectious virus shedding in all upper respiratory samples from patients infected with the SARS-CoV-2 Omicron variant, Japan, November 29–December 18, 2021. A) SARS-CoV-2 RNA levels in NP swab samples (open circles) and saliva (closed circles) with or without infectious virus. Red lines indicate median Cq values and error bars interquartile ranges; dotted lines indicate negative cutoff values. The Cq values between samples from which infectious virus was isolated and samples from which infectious virus was not isolated were compared by using the Mann-Whitney test. B) SARS-CoV-2 RNA levels and presence of infectious virus organized by the days after diagnosis. Red circles indicate symptomatic case-patients; blue circles indicate asymptomatic case-patients; each closed circle indicates case-patients from whom virus was isolated. Numbers above each plot indicate the proportion of case-patients from whom virus was isolated in each period. Black lines indicate median Cq values and error bars interquartile ranges; dotted lines indicate negative cutoff values. Cq, quantification cycle; NP, nasopharyngeal; SARS-CoV-2, severe acute respiratory syndrome coronavirus 2; +, with infectious virus; –, without infectious virus.