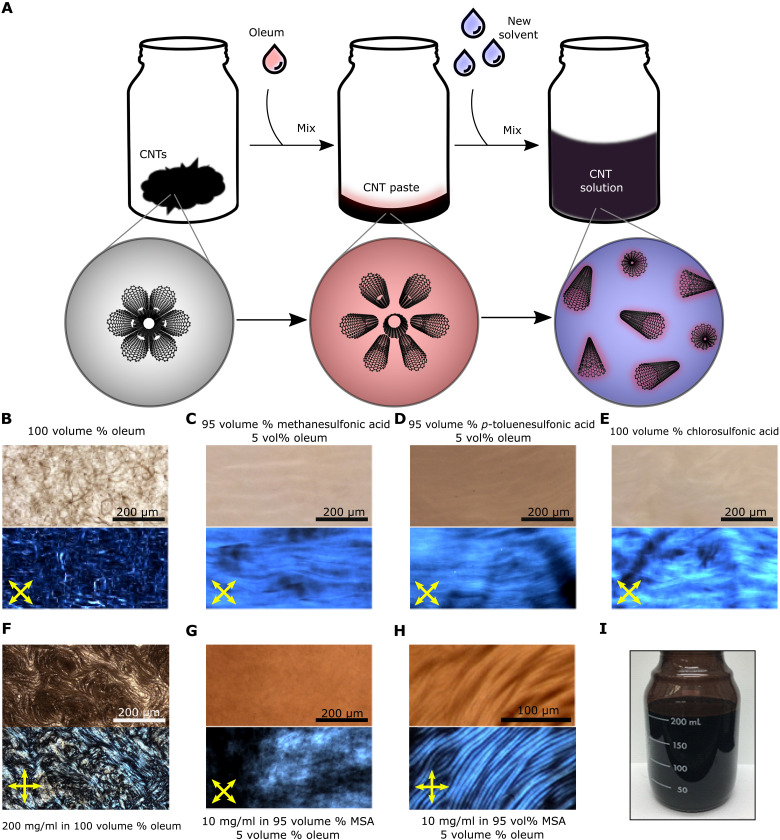
Fig. 1. Dissolution process and optical imaging of CNTs dissolved in various acids.
(A) Dissolution strategy for preparing solutions of high-quality CNTs. Upon addition of oleum, CNTs become charged and separated, forming swollen strand-like structures. The diluting solvent then further separates the individual CNTs from each other. (B to H) Transmitted light (top half) and cross-polarized microscopy (bottom half) images of (B) spaghetti phase in 100 volume % oleum and bulk liquid crystalline solutions in (C) 95 volume % MSA and (D) pToS mixed with 5 volume % oleum, (E) pure CSA, (F) liquid crystalline paste (200 mg/ml) in pure oleum before dilution, (G) CNTs (10 mg/ml) in 95 volume % MSA with 5 volume % oleum, displaying bulk liquid crystalline behavior and (H) shear banding induced after sliding the bulk liquid crystalline solution between glass slide and coverslip. (I) Two hundred milliliters of 0.5 mg/ml CNTs dissolved in 95 volume % pToS with 5 volume % oleum, demonstrating the scalable nature of the dissolution strategy.

