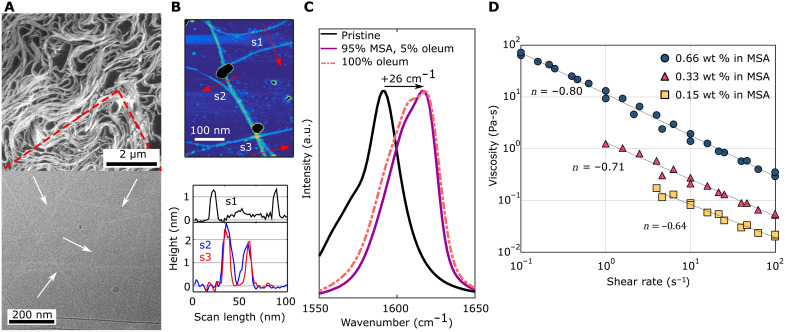
Fig. 2. Strong acid-CNT interaction yields individualization.
(A) Cryo-SEM (top) and cryo-TEM (bottom) micrographs of CNTs dissolved in 95 volume % MSA with 5 volume % oleum at 0.5 and 0.05 mg/ml, respectively, showing locally aligned liquid crystalline domains and individualized CNTs. (B) AFM image of CNT deposited from dilute MSA solution (top) height profile scans (bottom). Line scans reveal individual CNTs with diameters of approximately 1.3, 1.9, and 2.4 nm. (C) Raman spectra of the G peak region of pristine CNTs (in air) and dissolved in acids. a.u., arbitrary units. (D) Shear thinning rheological behavior of CNTs dissolved in 95 volume % MSA with 5 volume % oleum at 2.3, 5, and 10 mg/ml. Each sample was tested twice to verify solution stability. The shear thinning index, n, for each curve is indicated.

