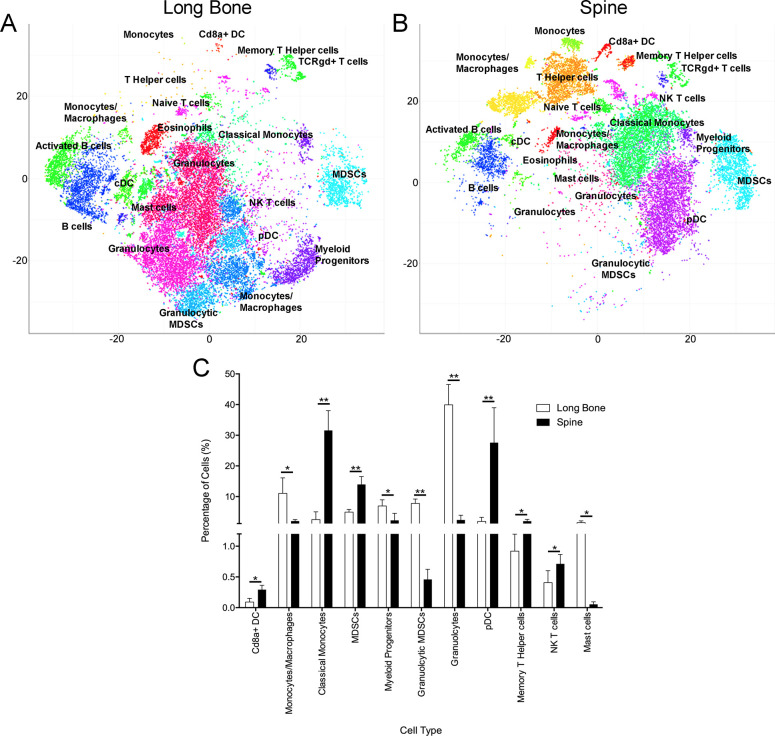
Fig 1. Characterization of the immune microenvironments of mouse vertebra and femur bone marrow using CyTOF.
Representative t-SNE plots show PhenoGraph clusters for (A) long bone and (B) spinal bone marrow. (C) Frequencies of statistically different immune cell populations between the two bone marrow samples. All cell types listed were statistically significant; p < 0.05. n = 5, percent of cells (SD, * denotes p < 0.05, ** denotes p < 0.001).

