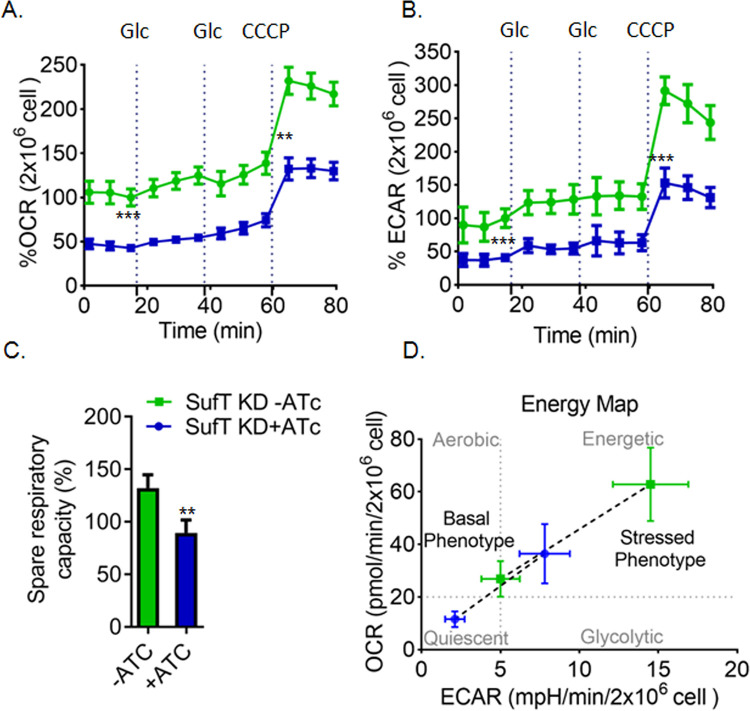
Fig 6. Depletion of SufT results in reduced OCR and ECAR.
(A) A change in % oxygen consumption rate (% OCR) and (B) % extra cellular acidification rate (% ECAR) of SufT-KD strain precultured for 72 h in the presence (+ATc) or absence (–ATc) of ATc and was measured after injection of 5 mM glucose (Glc) and 5 μM CCCP indicated by dotted lines. The uncoupler CCCP was used to determine the spare respiratory capacity (SRC). (C) Decrease in 20% SRC of SufT-KD+ATc with respect to SufT-KD-ATc. Percentage SRC was calculated by subtracting basal OCR (point before adding first Glc) to CCCP induced OCR. (D) Agilent Seahorse XF based Cell Energy Phenotype Profile of SufT-KD. The relative utilization of the two energy pathways (oxidative phosphorylation and glycolysis) is determined under both baseline (Baseline Phenotype) and stressed (Stressed Phenotype) condition after CCCP addition. All point of OCR and ECAR are normalized to CFU (2x10⁶ cells/well) and calculated in percent with respect to third basal point. Seahorse XF analyzer experiment was performed in triplicate with two independent replicates. Student’s t test (two tailed) was performed here with p values, *p≤0.05, **p≤0.01 and ***p≤0.001.

