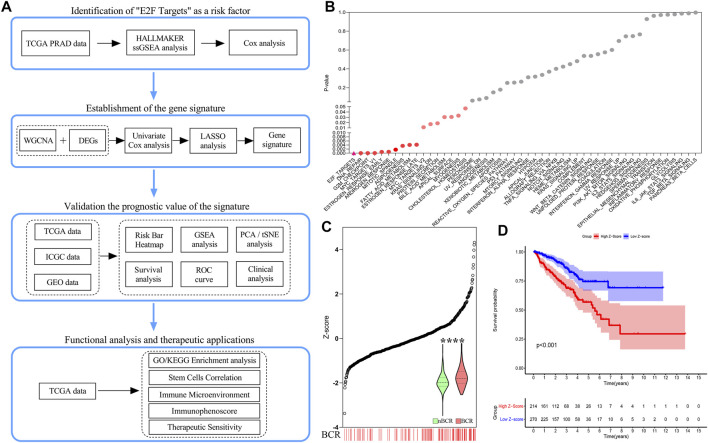
FIGURE 1.
Schematic diagram and identification of risk factors for the “E2F target” pathway. (A) Research design and process diagram. (B) Univariate Cox regression analysis revealed a significant correlation between the “E2F target” pathway and poor prognosis. (C) The number of BCR patients increased significantly with increasing z-score. (D) The prognosis of the high z-score group was worse than that of the low z-score group by Kaplan–Meier analysis.

