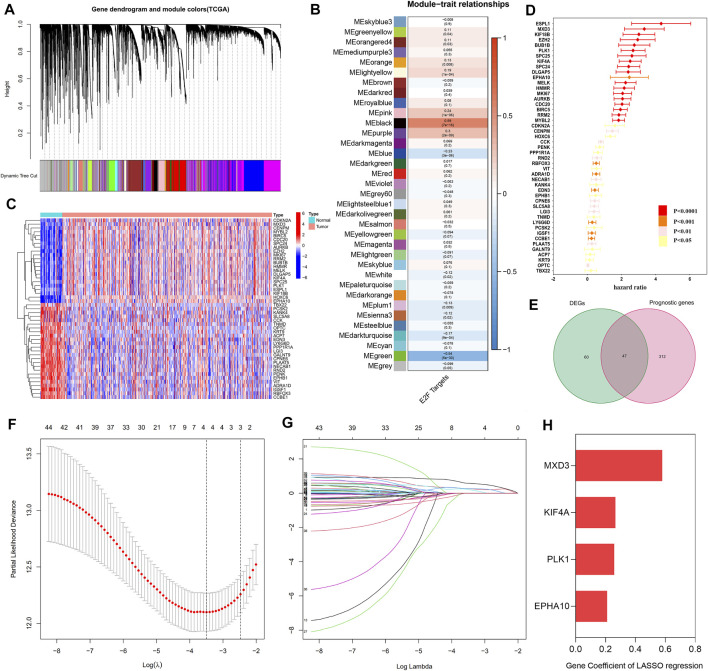
FIGURE 2.
Establishment of the “E2F target” risk score. (A–B) WGCNA showed that the gene in MEblack had the highest correlation with the activation of the “E2F target” pathway. (C) The heat map showed the top part of DEGs between the prostate tumor and normal prostate tissue. (D) Prognostic genes with statistical significance were screened by univariate Cox regression analysis. (E) The Venn diagram showed 47 prognostic differential genes obtained after the intersection of DEGs and prognostic genes. (F–G) LASSO Cox regression was used to establish the signature; the best log(λ) value was -3.5, and 4 indicators remained. (H) The LASSO coefficients of the 4 genes in the signature.

