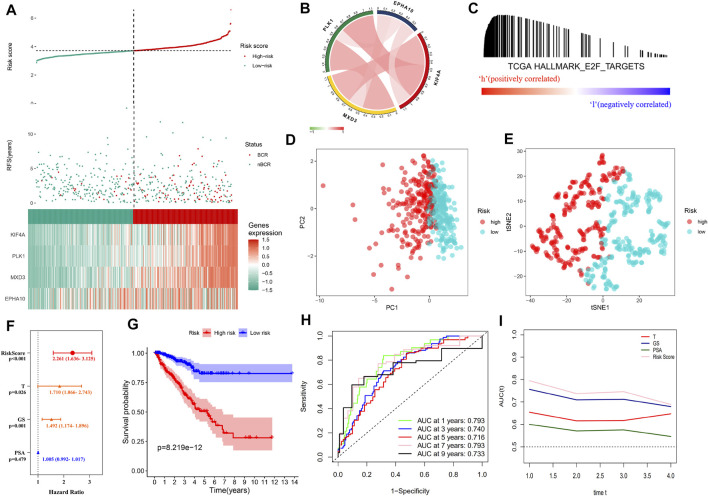
FIGURE 3.
Distribution of the “E2F target” risk score in TCGA cohort. (A) Patient risk score–survival distribution map and gene expression heat map of “E2F target”-related genes. (B) Gene correlation heat map showing low correlation among genes. (C) GSEA proved that in the high-risk group, the “E2F Target” pathway was activated. (D–E) PCA and tSNE analysis indicated that the model could be used to distinguish between different risk groups. (F) The “E2F target” risk score was an independent prognostic factor for poor prognosis. (G) Kaplan–Meier survival analysis confirmed that patients with a high-risk had a worse prognosis. (H) The 10-year AUC determined by ROC analysis of the gene signature was relatively high, suggesting that the predictive ability of the signature was good. (I) Compared with the T stage, Gleason score, and PSA, the average AUC of the risk score was the highest, indicating that the predictive ability of the risk score was the best.

