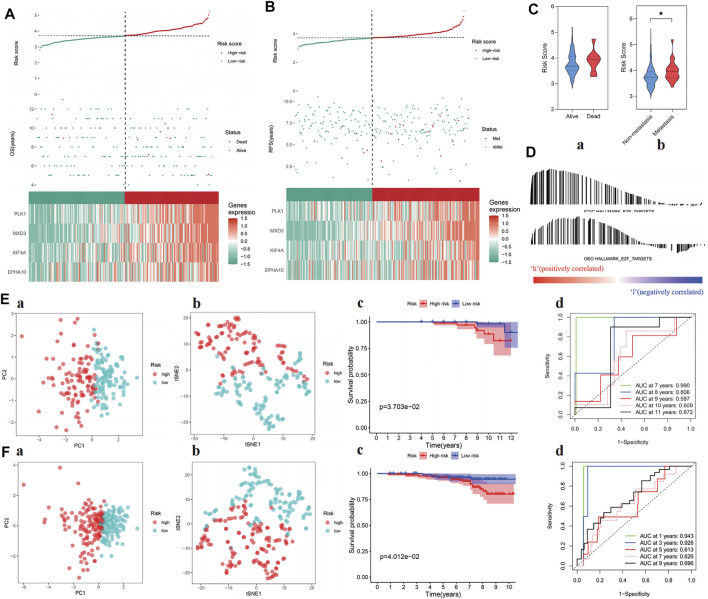
FIGURE 4.
Verification of prognostic ability of “E2F target” risk score in ICGC and GEO cohort. (A–B) Patients’ risk score–survival distribution map and gene expression heat map of “E2F target”-related genes in ICGC (left) and GEO (right) cohorts. (C) The “E2F target” risk score of patients with poor prognosis increased in both ICGC (left) and GEO (right) cohorts. (D) GSEA proved that at the high-risk group, the “E2F target” pathway was activated in both cohorts. (E–F) The ability of the “E2F target” risk score to distinguish high-risk patients was verified by PCA and tSNE in ICGC (Ea, Eb) and GEO (Fa, Fb) cohorts, and the prognosis of the high-risk group was significantly worse than the low-risk group (Ec, Ed, Fc, and Fd).

