
FIGURE 5.
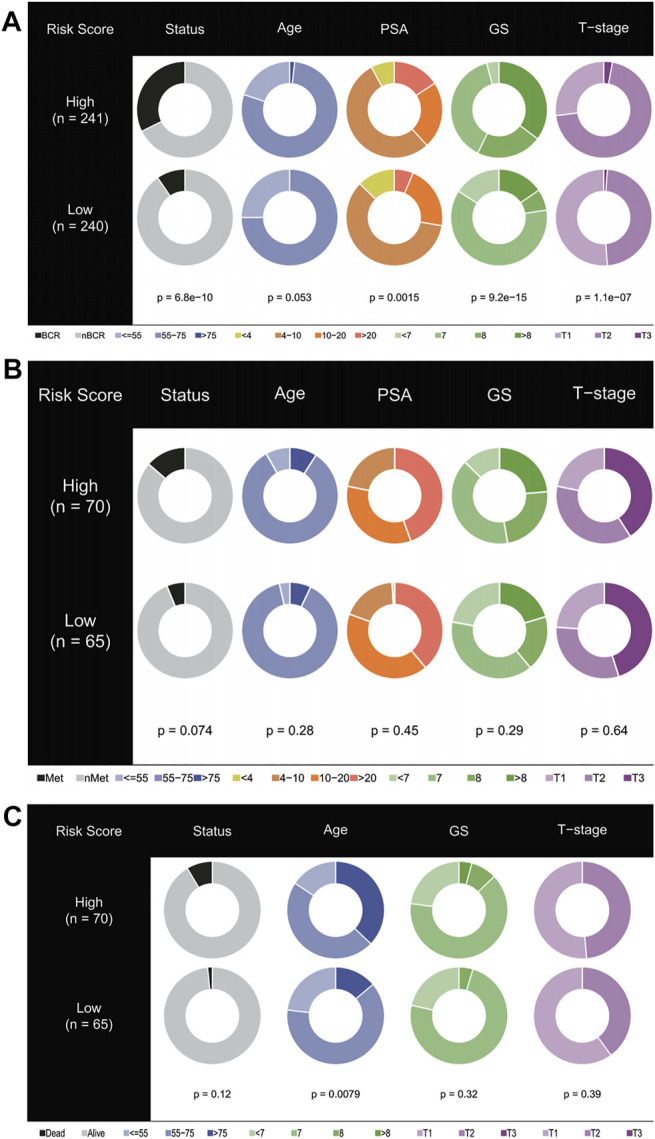
Stratified proportion of clinical characteristics of patients with prostate cancer in high- and low-risk groups. In the TCGA (A), ICGC (B), and GEO (C) cohorts, patients with higher PSA, GS, and T stage accounted for an increase in the high-risk group.