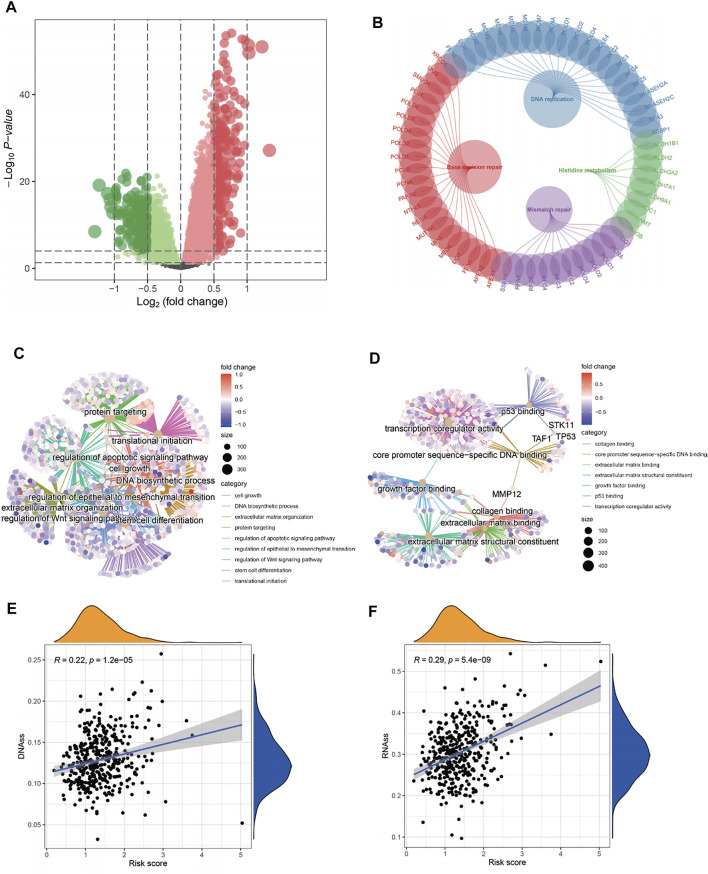
FIGURE 6.
Functional analysis and correlation analysis of stem cell characteristics and risk score. (A) Volcano diagram of DEGs between high- and low-risk groups. (B–D) KEGG and GO enrichment analysis showed that DNA replication, mismatch repair, cell growth, extracellular matrix remodeling, and binding pathways were active in patients with a high-risk, as well as the p53 pathway, wnt pathway, and stem cell differentiation. On the contrary, histidine metabolism was inhibited. (E–F) The “E2F target” risk score was positively correlated with DNAs and RNAs.

