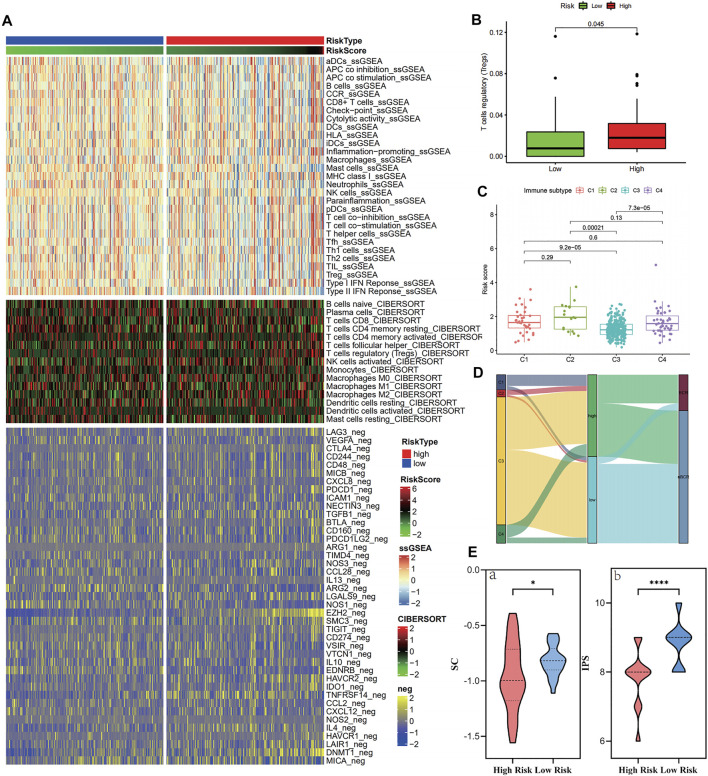
FIGURE 7.
Immune cell infiltration in the high- and low-risk groups in the training cohort. (A–B) Tregs and negative immunoregulatory genes were highly expressed in the high-risk score group. (C–D) Immunotyping results showed that C1, C2, and C4 types were increased in the high-risk group. (E) The IPS algorithm showed a significant increase in SC (a) and CP (b) in the high-risk group.

