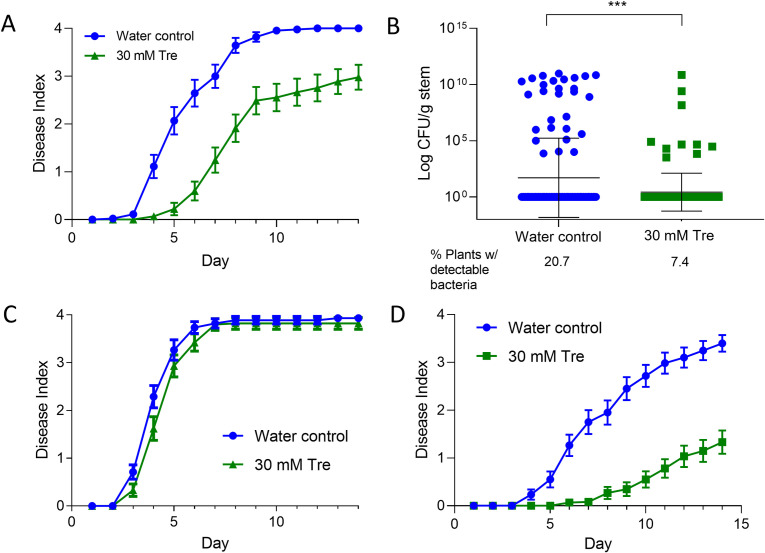
Fig 4. Treating plants with trehalose at the root delayed bacterial wilt symptoms and reduced R. solanacearum stem colonization, but only following soil inoculation.
A) Wilt disease progress of cv. Bonny Best tomato plants treated with trehalose, then after 48 h soil soak inoculated with R. solanacearum GMI1000. Disease symptoms were rated on a 0–4 disease index scale where 0 = no wilt, and 4 = 76–100% wilted or dead. Trehalose treatment delayed appearance of wilt symptoms (P = .0082, t-test comparing areas under the curves or AUC). Data represent three replicate experiments, each with 15 plants/treatment. Bars represent standard error. B) Bacterial population sizes were smaller in stems of trehalose-treated plants at 5–7 days after inoculation (Mann-Whitney, P = .0009). Data represent three biological replicates with 15 plants/day sampled/treatment; each dot represents the R. solanacearum population size in one plant (including plants without detectable R. solanacearum). Black bars represent geometric mean and standard deviation of the data. The percentage of plants that contained any detectable R. solanacearum cells is shown below the X-axis; the limit of detection is ~102 cells. Relative to controls, fewer trehalose-treated plants contained detectable R. solanacearum populations (Chi-square, P = .0016). C) Disease progress of plants treated with trehalose (green) or water (blue), then 48 h later inoculated by introducing R. solanacearum directly into the xylem through a cut leaf petiole. Trehalose treatment did not affect wilt disease development in petiole-inoculated plants (P = .2067, T-test of AUC). Data represent three replicate experiments, each containing 15 plants/treatment. Bars represent standard error. D) Disease progress of plants treated with 30 mM trehalose or water, then 120 h later inoculated with R. solanacearum the soil drench method (P = .0003, T-test of AUC) Data represent four replicate experiments, each containing 15 plants/treatment. Bars represent standard error of the mean.

