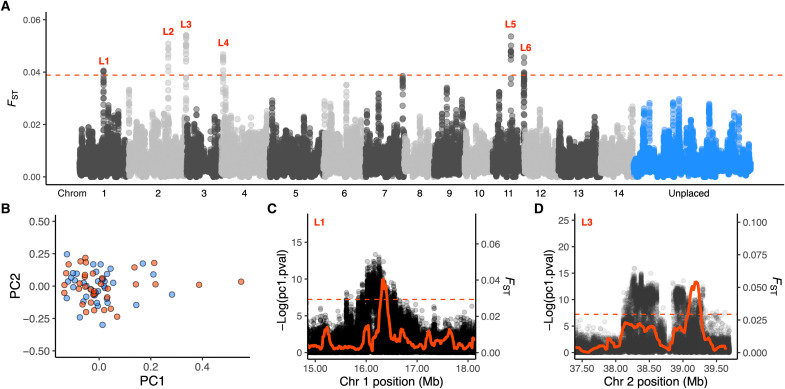
Fig. 3. Genome-wide patterns of differentiation in A. tenuis from lagoon and slope habitats.
(A) Manhattan plot of FST across the genome using 100-kb windows (10-kb step) and based on the unfiltered SFS. Alternating colors indicate different chromosomes. Each point is the average FST for all SNPs in that window. Red dashed line denotes top 0.01% windows. (B) Scatterplot of the first two principal components for colonies from lagoon (red) and slope (blue) habitats. (C and D) Zoomed-in plots of FST (red line, 100-kb windows) and population-independent selection coefficients (PCAngsd) for SNPs (black points) surrounding outlier regions calculated in PCAngsd (44). The program uses posterior expectations of the genotypes to identify SNPs with a distribution that exceeds expectations under neutrality along the first principal component (44). We calculated this selection statistic for each SNP (MAF > 0.05) along each chromosome separately and calculated outlier probabilities using the pchisq function (two-tailed mode) in R.

