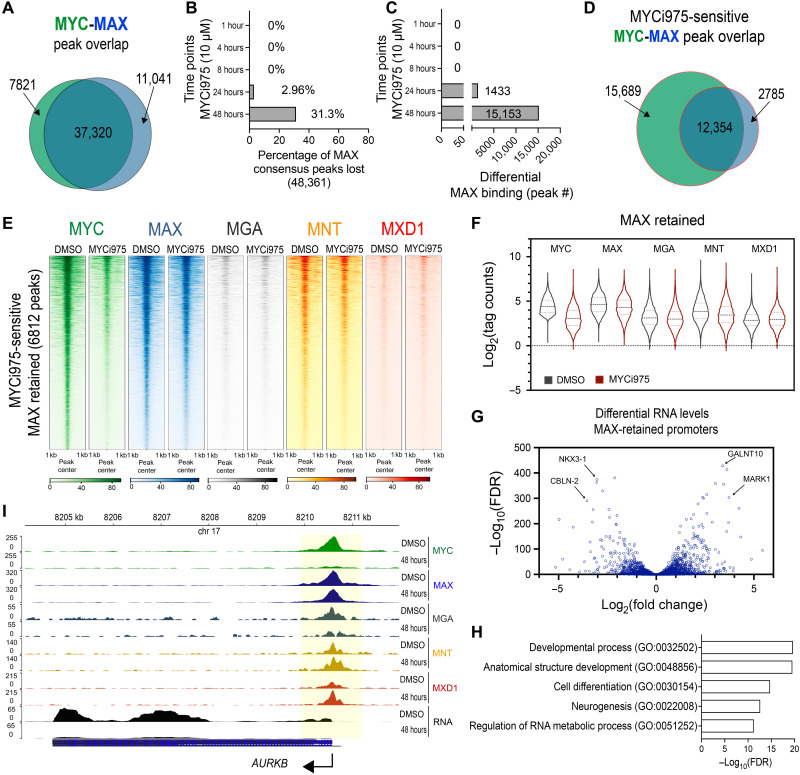
Fig. 4. Differential MAX, MGA, and MNT chromatin binding alterations in MYCi975-treated cells.
(A) Peak overlap analysis of MYC and MAX consensus peaks (n = 4). (B) Percentage of differential MAX binding peaks lost in response to MYCi975 compared to MAX consensus peaks (n = 4). (C) Total number of differentially bound MAX peaks following differential binding analysis (n = 4). (D) Peak overlap analysis of differential MYC- and MAX-bound sites (MYCi975 sensitive) in MYCi975-treated 22Rv1 cells. (E) Heatmap representation of MYC, MAX, MGA, MNT, and MXD1 at MYCi975-sensitive sites demonstrating no significant change in MAX occupancy (6812 peaks in total). (F) Log2(normalized tag counts) for MYC, MAX, MGA, MNT, and MXD1 at MAX-retained peaks in 22Rv1 cells. The middle dashed line represents the sample median, and the upper and lower dotted lines represent the upper and lower quartiles, respectively. (G) Differential gene expression analysis of MAX-retained peaks annotated to promoters (±2 kb from the TSS). (H) Gene ontology analysis of promoter-bound MAX-retained peaks. (I) Gene browser tracks of AURKB showing loss of MYC (green), retention of MAX (blue), an increase in MXD1 (red), and loss of AURKB mRNA (black) in 48-hour MYCi975-treated cells. MGA (gray) and MNT (yellow) are also displayed.

