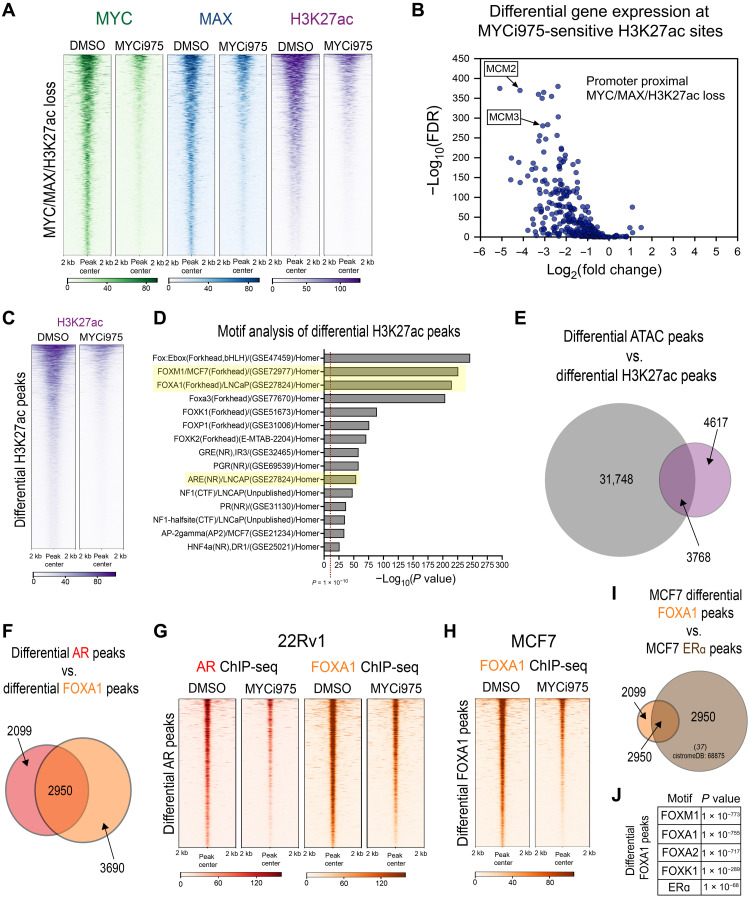
Fig. 5. MYCi975 alters H3K27ac activity and FOXA1 chromatin occupancy in cancer cells.
(A) Heatmap representation of MYC (green), MAX (blue), and H3K27ac (purple) ChIP-seq signals at overlapping sites, with loss of signal in MYCi975-treated cells (2218 peaks). (B) Differential binding analysis of H3K27ac ChIP-seq was performed and overlapped with MYCi975-sensitive sites. Sites annotated to promoters were cross-referenced with differential gene expression data consisting of 304 genes. The plot demonstrates that loss of MYC/MAX occupancy and H3K27ac signal results in down-regulated gene expression. (C) Heatmap representation of H3K27ac loss of signal in MYCi975-treated cells (8385 peaks). ChIP-seq signal in the MYCi975 column represents 48-hour MYCi975 treatment. (D) Motif enrichment analysis was performed to assess the differential H3K27ac signal, showing enrichment for FOX factors and nuclear receptors [AR, GR, and progesterone receptor (PGR)]. Each P value reported was converted to −log10(P value). (E) Venn diagram representing differential H3K27ac and differential ATAC-seq peak overlap in MYCi975-treated 22Rv1 cells (H2K27ac, n = 2; ATAC-seq, n = 3). (F) Venn diagram representing differential AR and FOXA1 peak overlap in MYCi975-treated 22Rv1 cells. (G) Heatmap representation of AR and FOXA1 ChIP-seq signal at differential AR peaks in MYCi975-treated 22Rv1 cells (n = 3). (H) FOXA1 ChIP-seq signal in MCF7 cells at differential FOXA1 peaks found in MYCi975-treated MCF7 cells (n = 2). (I) MCF7 differential FOXA1 peak overlap with publicly available MCF7 ERa ChIP-seq peaks (http://cistrome.org/db/#/, PMID: 27062924). (J) Motif enrichment analysis results of the differential FOXA1 peaks.

