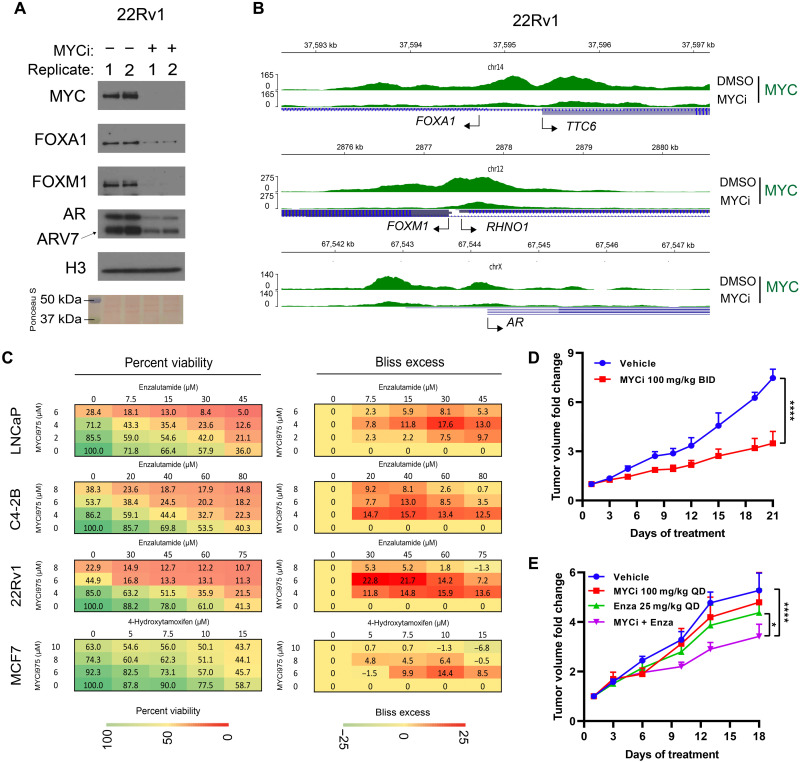
Fig. 6. MYCi975 enhances the efficacy of antihormone therapy.
(A) Immunoblot showing loss of FOXM1, FOXA1, AR, and AR variant protein levels in sonicated nuclear fractions of MYCi975-treated 22Rv1 cells. Replicates (1 and 2) represent biological replicates of cells treated with 10 μM MYCi975 for 48 hours. (B) Genome browser tracks of MYC (green) ChIP-seq data at the FOXA1, FOXM1, and AR gene loci in MYCi975-treated 22Rv1 cells. TSS of each gene is indicated by an arrow. (C) Representative 4 × 5 dose-response matrices showing percentage viability (left) and Bliss index (right) analysis of predicted versus observed cell viability of prostate cancer cells (LNCaP, C4-2B, and 22RV1) treated with MYCi975 and ENZ or the breast cancer line MCF-7 treated with MYCi975 and 4-OHT (n = 3). Bliss scores > 0 indicate synergy, scores close to zero indicate additivity, and scores < 0 denote antagonism. (D) Fold change tumor volumes of 22Rv1 xenografts in nude mice treated with MYCi975 (100 mg/kg BID p.o.) or vehicle, 5 days a week for 3 weeks. n = 4 to 7 grafts per group (from three to four mice). (E) Fold change tumor volumes of 22Rv1 xenografts in nude mice treated with MYCi975 (100 mg/kg QD p.o.), ENZ (25 mg/kg QD i.p.), combination of MYCi975/ENZ, or vehicle for 18 days. n = 7 to 8 grafts per group (from four to five mice). Error bars represent means ± SEM and analyzed by two-way analysis of variance (ANOVA) in GraphPad Prism for (D) and (E) (*P < 0.05; ****P < 0.0001).

