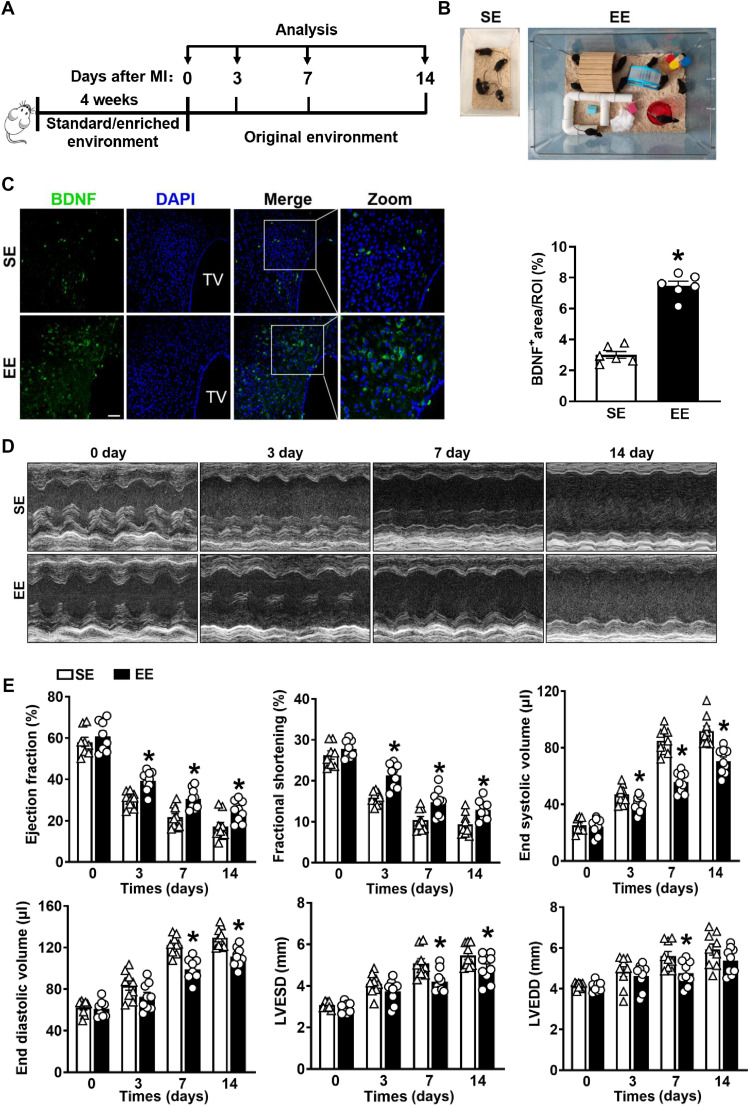
Fig. 1. Model establishment and cardiac function comparison between SE and EE mice after MI.
(A) Timeline diagram of the experimental procedures. (B) Cage setup of the SE and EE housing. (C) Immunostaining analyses of BDNF in the hypothalamus of wild-type (WT) mice after 4 weeks of SE and EE housing (n = 6). TV, third ventricle; *P < 0.05 versus SE mice. Scale bars, 40 μm. DAPI, 4′,6-diamidino-2-phenylindole. (D) Typical M-mode images of the hearts were obtained from mice at days 3, 7, and 14 after MI or sham surgery. (E) EF, FS, left ventricular ESV, left ventricular EDV, LVESD, and LVEDD were measured using echocardiography at 3, 7, and 14 days after MI or sham surgery (n = 8 to 9). *P < 0.05 versus SE. Data are expressed as means ± SEM. Data in (C) were analyzed using the Student’s t test. Data in (E) were analyzed using two-way analysis of variance (ANOVA) followed by Bonferroni post hoc analysis.

