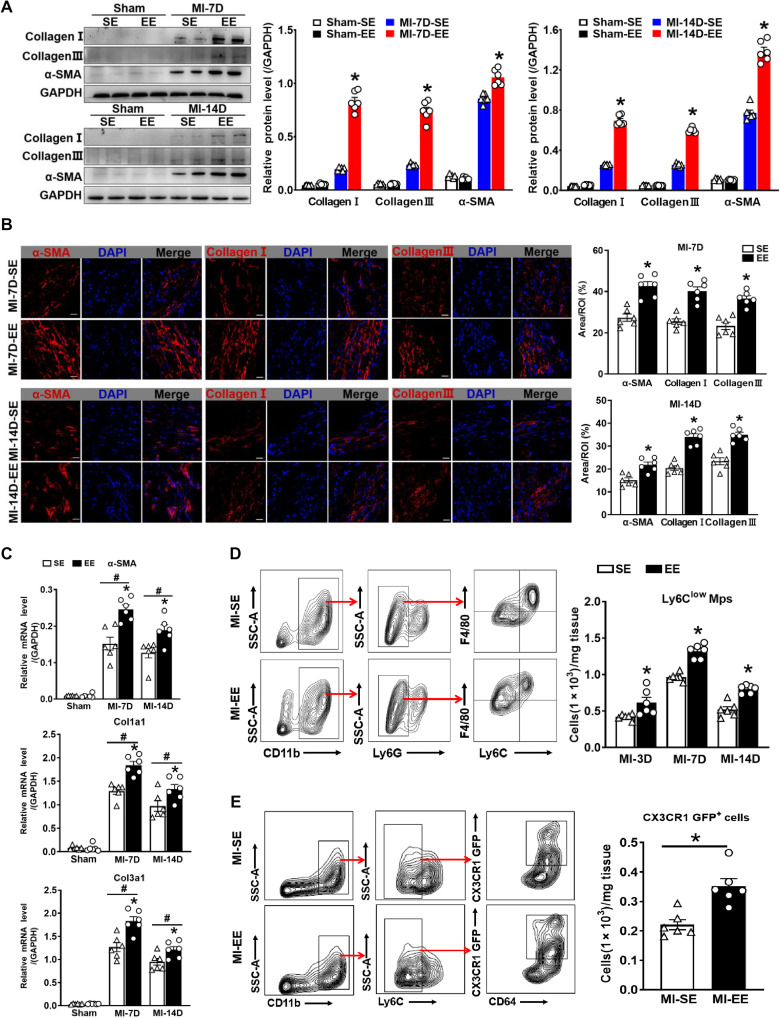
Fig. 3. EE promotes ECM synthesis and increases the number of Ly6Clow macrophages.
(A) Western blot analyses of collagen I, collagen III, and α-SMA protein expression in the scar tissues of SE and EE mice at days 7 and 14 after MI or sham surgery (n = 6). *P < 0.05 versus SE-MI. GAPDH, glyceraldehyde-3-phosphate dehydrogenase (B) Immunostaining analyses of α-SMA, collagen I, and collagen III in the infarct area of SE and EE mice. Scale bars, 20 μm. *P < 0.05 versus SE. (C) mRNA expression of α-SMA, collagen 1a1 (Col1a1), and Col3a1 in the scar tissues of SE and EE mice at days 7 and 14 after MI or sham surgery (n = 6). #P < 0.05 versus sham. *P < 0.05 versus SE. (D) Gating strategy for Ly6Clow Mps and Ly6Chigh Mos/Mps in hearts after MI. Flow cytometry–based quantification of Ly6Clow Mps at days 3, 7, and 14 after MI (n = 5 to 6). *P < 0.05 versus SE. (E) Gating strategy for CD45+CD11b+Ly6C−CD64+CX3CR1-GFP+ macrophages of SE- and EE-housed CX3CR1-GFP mice at day 14 after MI. Quantification of CX3CR1-GFP+ macrophages (n = 6). *P < 0.05 versus SE. Data are expressed as means ± SEM. Data in (C) were analyzed using two-way ANOVA followed by Bonferroni post hoc analysis. Data in (A), (B), (D), and (E) were analyzed using Student’s t test.

