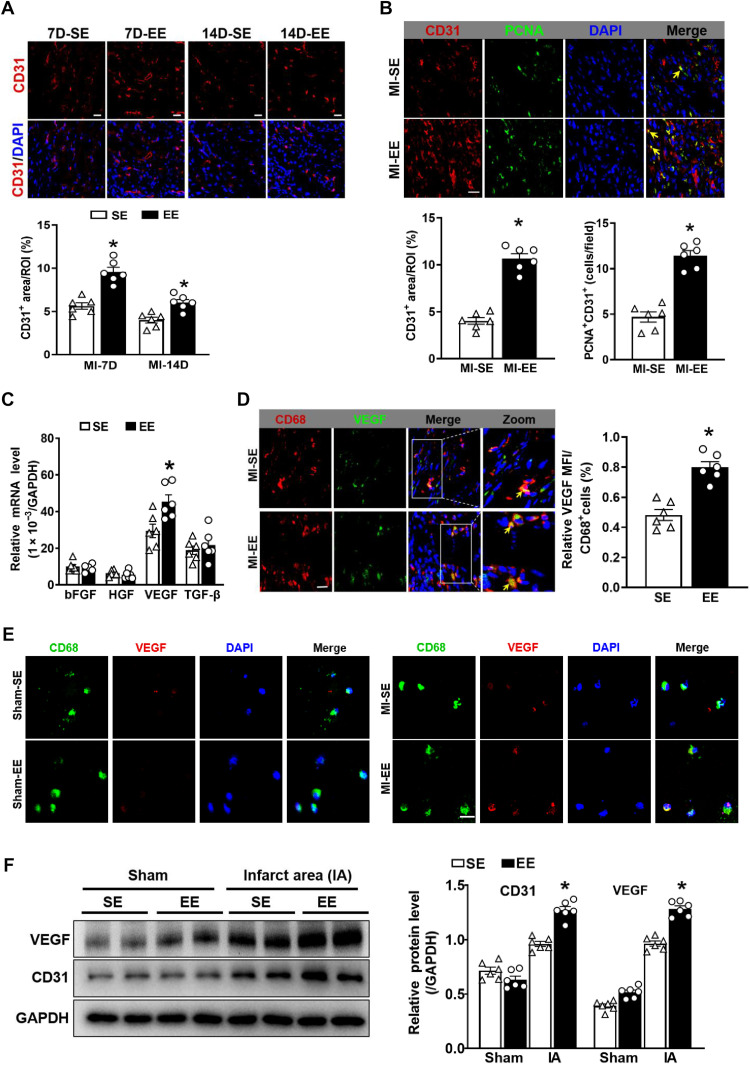
Fig. 4. EE promotes angiogenesis in infarct by VEGF secreted from Ly6Clow macrophages.
(A) Immunostaining analyses of CD31 in infarct tissue collected at 7 and 14 days after MI. Scale bars, 20 μm. *P < 0.05 versus SE. (B) Immunostaining of CD31 (red) and PCNA (green) in the infarct zone. Scale bars, 20 μm. The yellow arrow indicates CD31+/PCNA+ cells. Quantitation of CD31+ areas and CD31+/PCNA+ cells (n = 6). *P < 0.05 versus SE. (C) mRNA expression levels of fibroblast growth factor (FGF), hepatocyte growth factor (HGF), VEGF, and TGF-β in Mos/Mps sorted from hearts in SE-treated and EE-treated mice at day 7 after MI. *P < 0.05 versus SE. (D) Immunostaining for CD68 (red) and VEGF (green) in infarct tissue from SE and EE mice at day 7 after MI. Scale bars, 20 μm. The solid box outlines the region enlarged to the right. The yellow arrow indicates CD68+/VEGF+ cells. Quantitation of VEGF signaling in CD68+ cells (n = 6). *P < 0.05 versus SE. (E) Representative immunostaining for CD68 (green) and VEGF (red) in Mos/Mps sorted from hearts of SE- and EE-treated mice at day 7 after MI or sham operation. Scale bars, 50 μm. (F) Western blot analyses of VEGF and CD31 expression in the infarct tissue of SE and EE mice at day 14 after MI or sham surgery. IA indicates infarct area. N = 6. *P < 0.05 versus SE. Data are expressed as means ± SEM. Data were analyzed using Student’s t test.

