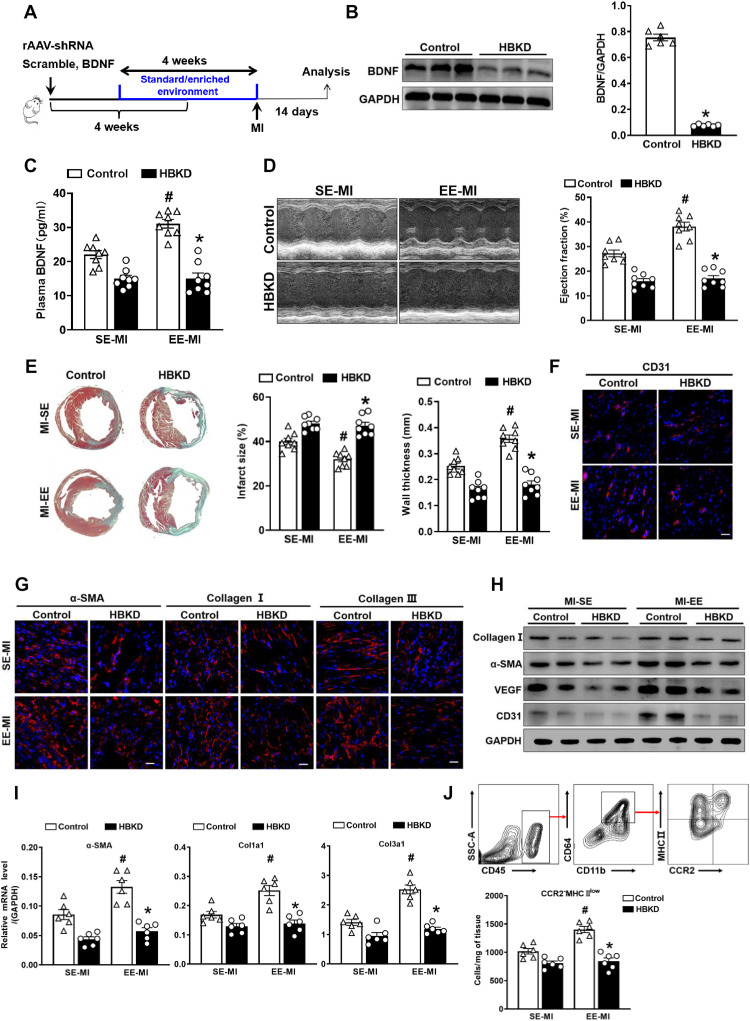
Fig. 8. Hypothalamic BDNF knockdown inhibits EE-induced cardiac repair.
(A) Timeline diagram of the experimental procedures. (B) Western blot analysis of BDNF expression in the hypothalamus between HBKD and control mice 4 weeks after the virus injection (n = 6). *P < 0.05 versus control. (C) The BDNF content in plasma of HBKD and control mice at day 14 after MI after SE and EE housing. #P < 0.05 versus SE-MI. *P < 0.05 versus control. (D) Echocardiographic analysis of EF value of HBKD and control mice at day 14 after MI after SE and EE housing (n = 8). #P < 0.05 versus SE-MI and *P < 0.05 versus control. (E) Masson’s staining of cardiac tissue obtained from HBKD and control mice at day 14 after MI after SE and EE housing. Quantitative analysis of infarct size and wall thickness (n = 8). #P < 0.05 versus SE-MI. *P < 0.05 versus control. (F and G) Immunostaining analyses of CD31, α-SMA, collagen I, and collagen III on infarct sections collected at 14 days after MI. Scale bars, 50 μm (for CD31) and 20 μm (for α-SMA, collagen I, and collagen III). (H) Representative Western blot analyses of collagen I, α-SMA, VEGF, and CD31 expression in the infarct tissues at day 14 after MI (n = 6). (I) mRNA expression of α-SMA, Col1a1, and Col3a1 in scar tissues at day 14 after MI. #P < 0.05 versus SE-MI. *P < 0.05 versus control. (J) Gating strategy and quantification of CCR2−MHCIIlow macrophages in the hearts of HBKD and control mice after MI (n = 6). #P < 0.05 versus SE-MI. *P < 0.05 versus control.

