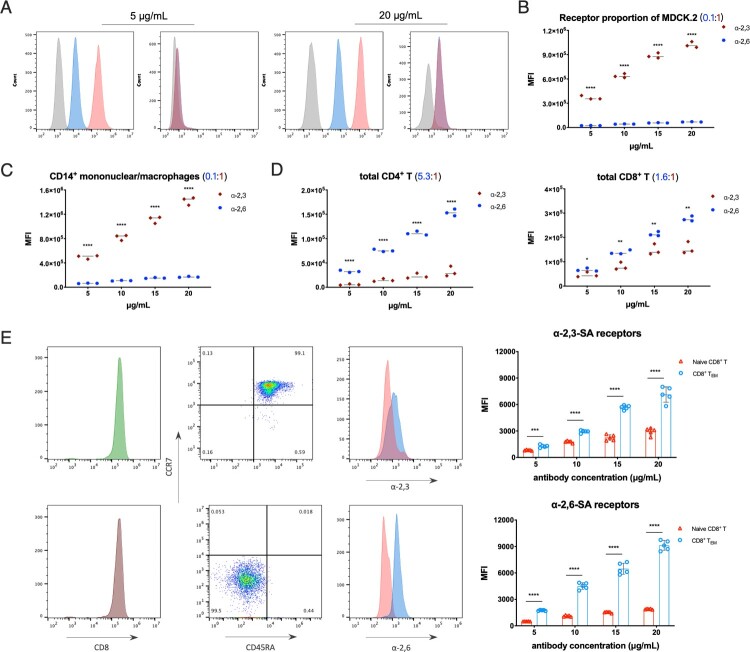
Figure 2.
Quantitative analysis of α-2,3- and α-2,6-linked sialic acid receptors in MDCK.2 and primary human T cells. (A) Flow cytometry analysis of broad-spectrum neuraminidases treated MDCK.2 cells or not with the lectin antibody concentrations of 5 and 20 μg/mL. Grey, unstained as controls; blue, α-2,6-linked sialic acid receptors; red, α-2,3-linked sialic acid receptors. (B) The comparison of α-2,6- and α-2,3-linked receptors in MDCK.2 cells from ATCC. (C) The comparison of α-2,6- and α-2,3-linked receptors of human CD14+ mononuclear/macrophages. (D) The comparison of α-2,6- and α-2,3-linked receptors of human total CD4+ T and total CD8+ T cells. (E) Purities of gating and MFI of receptors with the lectin antibody concentrations of 5 μg/mL in CD8+ TEM and naïve CD8+ T cells and the quantitative analysis of α-2,6- and α-2,3-linked sialic acid receptors between CD8+ TEM and naïve CD8+ T cells from five healthy donors. Both CD8+ TEM and naïve CD8+ T cells were stained with identical fluorescent antibodies. Red, naïve CD8+ T; blue, CD8+ TEM. Results of (B-E) are represented as mean fold change ± SD and statistical significances were analysed using GraphPad Prism 8.0 through two-tailed Student’s t-test. *p < 0.05, **p < 0.01, ***p < 0.001, ****p < 0.0001.

