Figure 4.
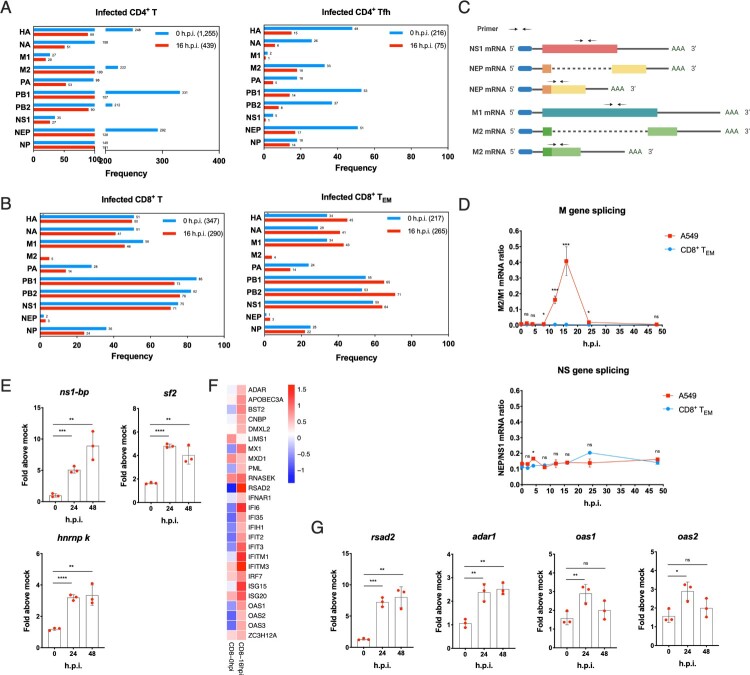
Abnormal splicing efficiency and up-regulation of ISGs dedicate to work for abortive infection in primary human T cells. (A) Frequency of different H1N1 viral genes in infected total CD4+ T and follicular helper T cells. Blue, 0h.p.i.; red, 16 h.p.i. (B) Frequency of different H1N1 viral genes in infected total CD8+ T and CD8+ TEM. Blue, 0h.p.i.; red, 16 h.p.i. (C) Schematic representation of alternative splicing of M1 and NS1 mRNA and their alternatively spliced product M2 and NEP (NS2) mRNA. The arrowheads show corresponding primer positions for detection. (D) Alternative splicing efficiency of M and NS genes in infected CD8+ TEM and A549 cells post-infection. Red, A549 cells; blue, CD8+ TEM. Results are represented as mean fold change ± SD and statistical significances were analysed using GraphPad Prism 8.0 by two-tailed Student’s t-test. *p < 0.05, **p < 0.01, ***p < 0.001, ****p < 0.0001, ns = non-significant. (E) mRNA expression levels of cell host splicing factors ns1-bp, sf2 and hnRNP K in CD8+ TEM post-infection. (F) The gene heatmap of ISGs in infected CD8+ TEM. Blue, down-regulation; red, up-regulation. (G) mRNA expression levels of rsad2, adar1, oas1 and oas2 in CD8+ TEM post-infection. Results of (E and G) are represented as mean fold change ± SD and statistical significances were analysed using GraphPad Prism 8.0 by two-tailed Student’s t-test. *p < 0.05, **p < 0.01, ***p < 0.001, ****p < 0.0001, ns = non-significant.

